

An interesting divergence is playing out in the market. While the Dow Jones is currently in the green for the week +1%, the NDX and SPX are down -3% and -0.9%, respectively. A major sector rotation is underway:
Semiconductors (SMH): Down -7.4% on the week, driven by sharp pullbacks in individual names like MU (-9.5%), AMD (-7.5%), and NVDA (-5%).
Defensives & Value: Consumer Staples XLP has jumped +3.9% so far this week, Healthcare XLV is up +3.7%, Materials XLB gained +2.3%, and Financials/Real Estate (XLF and XLRE) are both up +1%.
This is the daily moves breakdown per individual names in the SP500:
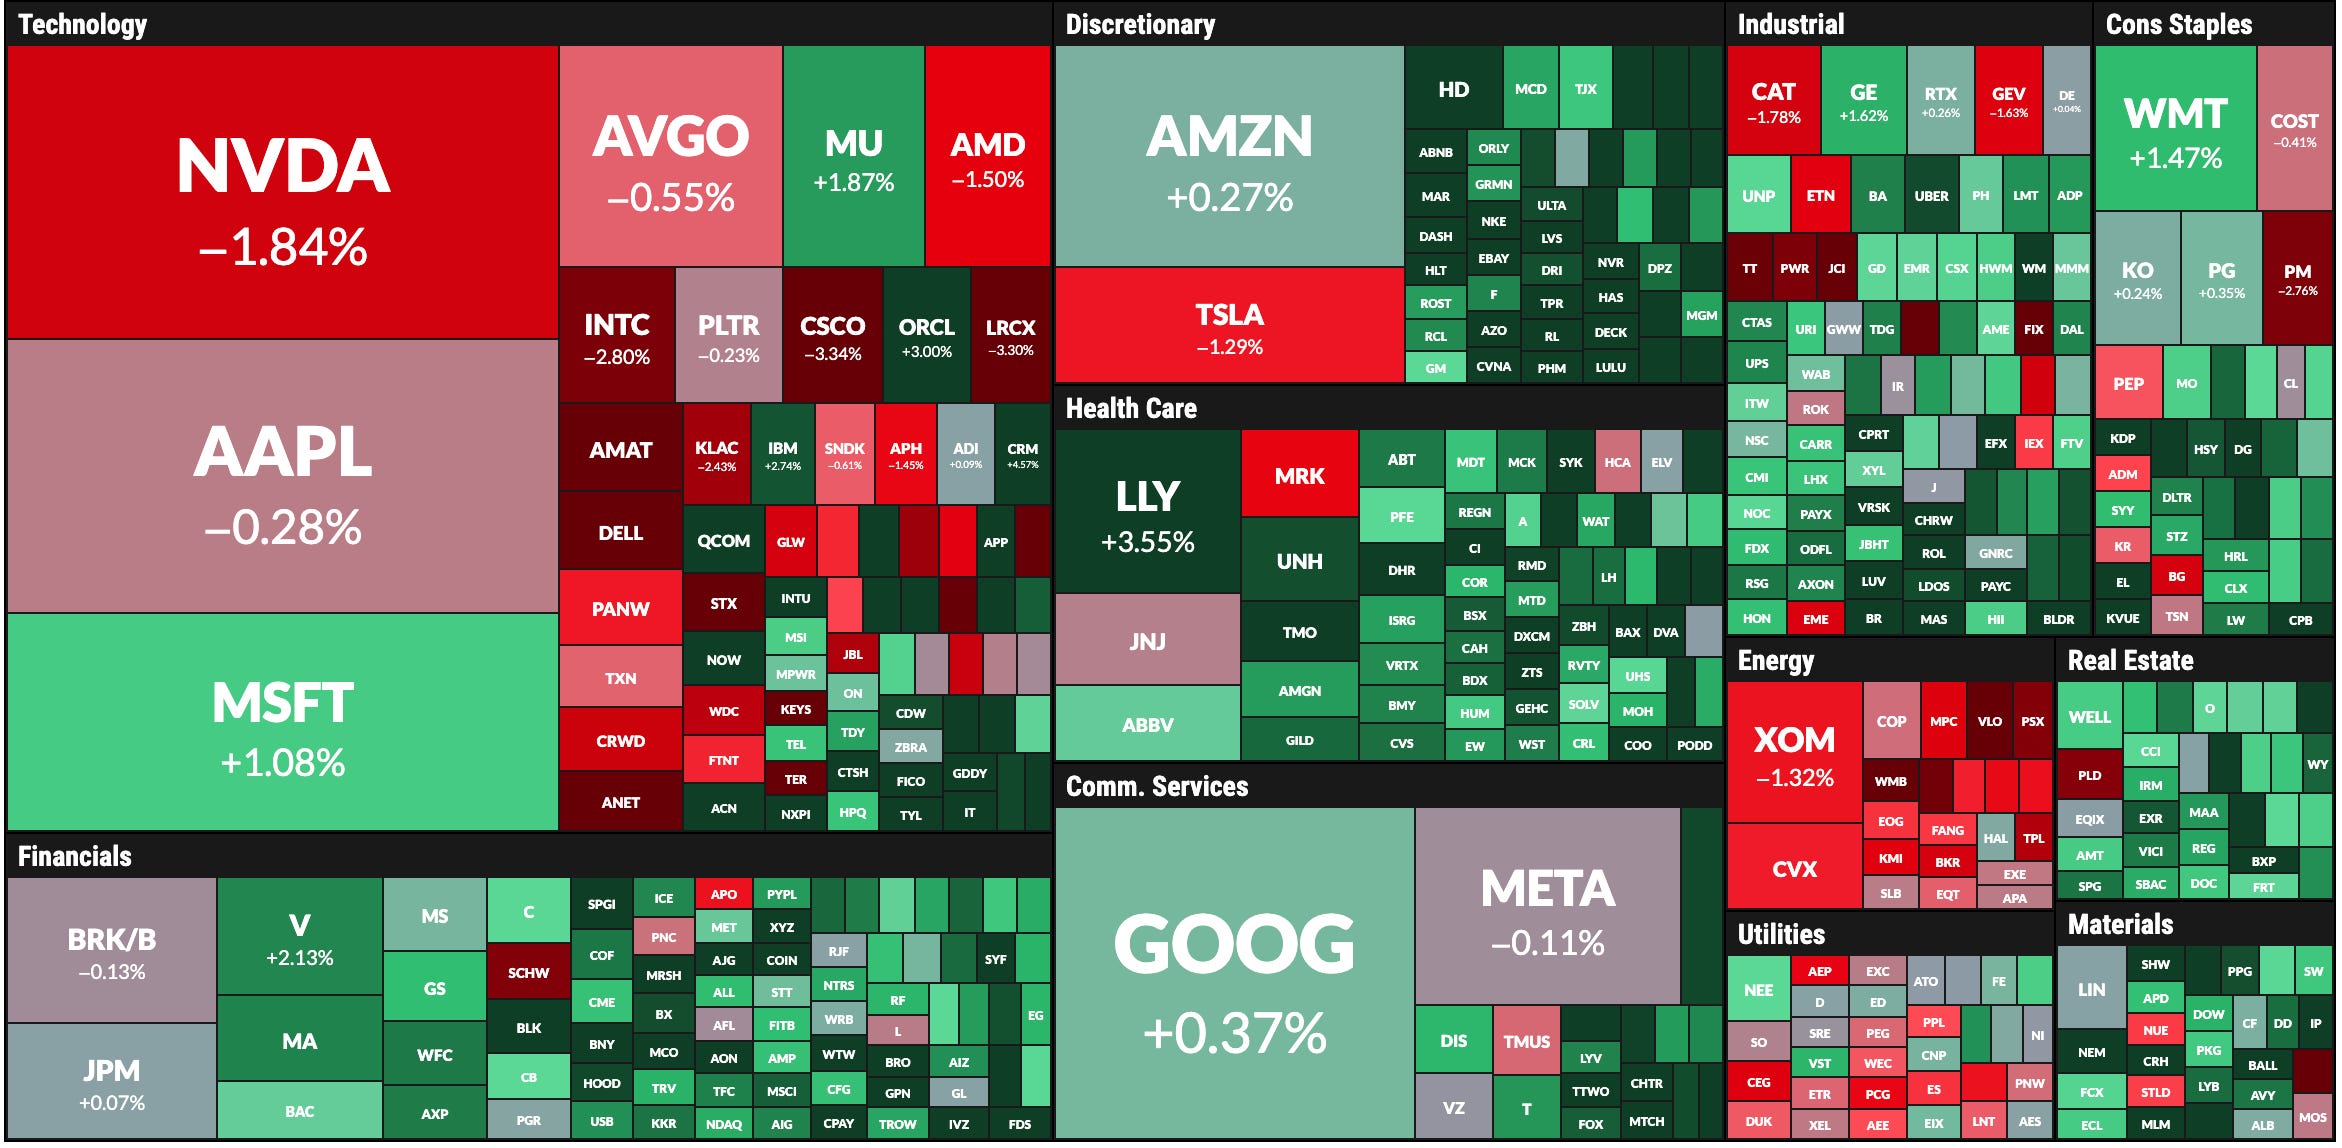
Price action closed with bearish conviction yesterday in technology names, affecting both the SPX and NDX. Today's session opened with a major gap down that, given oversold conditions, triggered a bounce that successfully filled the gap across the major indices.
The central question today is: Is this a failed breakdown marking the ultimate bottom, or just a technical bounce before the decline resumes?
During the past several days, I have warned about the imminent risk in the SPX and NDX, both of which carried very high probabilities of visiting 7,684 (765 for the SPY) and 29,647 for the NDX (720.9 for QQQ). Both milestones were achieved today, proving the bearish structure thesis right and validating that patience is key.
My bearish positioning for the indices and semiconductors was validated, as the declines for NVDA and AMD were anticipated last Saturday and both reached extended levels of 213 and 537, respectively. At the same time, bullish targets in COST and WMT were also anticipated with specific levels that today flipped from resistance to support. Furthermore, in last night’s mid-week update, I highlighted the bullish thesis for NFLX with clear parameters, and the stock rallied +2.9% today.
As we analyze this week’s action, the current market structure is not signaling a broad, systemic crash (also as anticipated). Instead, it is a sector rotation.
This dynamic highlights why maintaining a broad, diverse watchlist is essential for any serious trader or analyst. If you only watch a single sector, a rotation feels like a crisis. By tracking a comprehensive universe across technology, cyclicals, and defensives, you can spot where capital is flowing in real time, separate sector-specific pullbacks from genuine market crashes, and stay flexible enough to capitalize on opportunities wherever they emerge.
This is my Core Watchlist focused on megacaps and high-volume assets. If you trade some of these tickers, this publication is for you:
Indices & Futures: SPX, NDX, DJI, IWM, ES=F, NQ=F
ETFs: SPY, QQQ, SMH, TLT, GLD, SLV, DIA, VXX
Major Stocks: AAPL, MSFT, GOOG, AMZN, NVDA, META, TSLA, SPCX, LLY, WMT, AVGO, COST, JPM, XOM, PLTR, NFLX, V, AMD
Crypto & Related: Bitcoin, Ethereum, ETHA, IBIT
Leveraged ETFs: TQQQ, SQQQ, UDOW, SDOW, UPRO, SPXS, URTY, SRTY
Subscribe now to premium content and unlock this daily analysis, along with the weekend publications featuring key levels and setups for the week ahead. Subscribing also grants you full access to my educational library, including two eBooks on technical analysis (Essentials and Advanced), plus the ability to submit your preferred stocks every weekend to have their support and resistance levels modeled for the week ahead.
The Weekly Compass where the current moves were anticipated is here, along with my Market Intelligence Library:


Today’s Agenda
Is the Bottom In or Is This a Technical Bounce?
Daily plan for SPX, ES=F
Daily and Weekly Levels Combined for SPX, ES=F, MU, AMD, NVDA, QCOM, and Other Semiconductor Names
Watchlist Tracker (Momentum for each ticker and their distance to key levels)
Let’s begin.