
Make or Break: A Definitive Week for Market Direction
Sell-Off Continuation vs. Recovery of Critical Levels - Indicators to Watch


Despite the extreme bearish sentiment last weekend, I anticipated that a bounce was coming, citing a high likelihood of a relief rally, “as the SPY, QQQ, IWM, and DIA were showing potential for a trend reversal.” Pessimism was as high as it was in April 2025, but staying focused on technical indicators is essential, regardless of the noise.
Markets closed the first week of April with their first weekly gain since the Iran conflict began. The S&P 500 rose 3.4%, the Dow added nearly 3%, IWM rallied 3.4%, and the Nasdaq 100 surged 4%. In addition, other bullish setups were anticipated by this publication last Saturday: AMZN (bouncing 5.2% during the week) and NFLX (5.6%). A consolidation for XOM was expected, and on Monday, I highlighted the bearish reversal setup that initiated the -6% selloff seen this week.
For a forecast built on prudence in the current market conditions, this represents a 100% win rate. I am posting daily levels to help paid subscribers navigate this volatile market. Subscribe now and unlock the analysis for next week.
The Week Ahead: The question for the week ahead is not whether volatility will continue, it likely will. The real question is how oil prices, the Dollar Index, and the VIX will behave. The geopolitical escalations we saw late this week carry enough weight to significantly dampen sentiment, and every rally must recover the Central Weekly and Monthly Levels posted here to prove its sustainability.
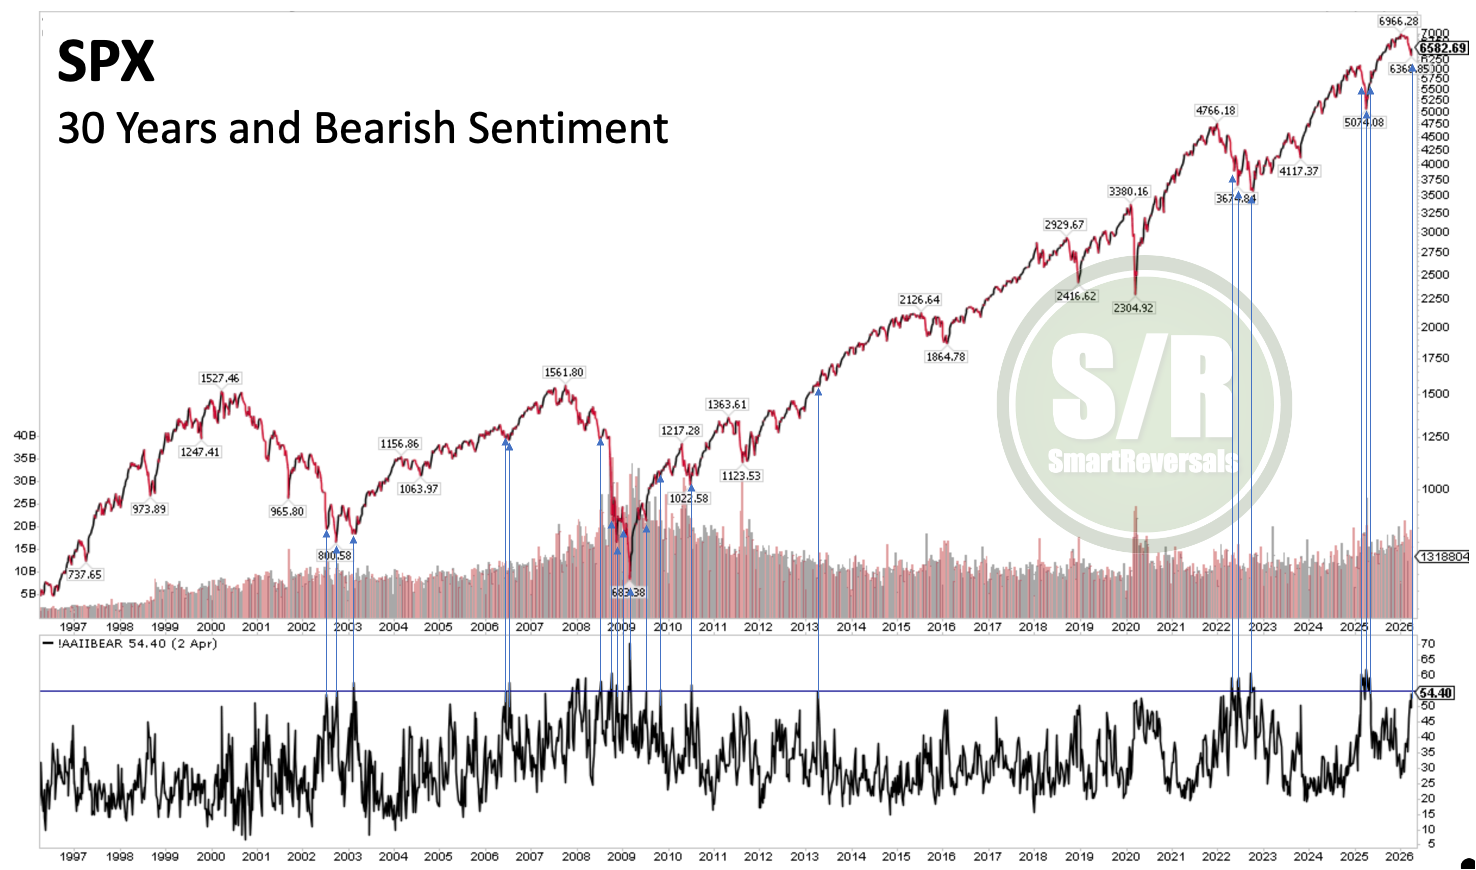
Bearish Sentiment is High: Over the last 30 years, we have seen this level of bearish sentiment only a few times, as highlighted in the chart below using the current 55% bearish sentiment leve as a reference. Given this week’s bounce from those extreme conditions, we must now monitor if this move will last two or three weeks (as typically seen even during bear market rallies) or if it will be short-lived, similar to 2025 when the market saw only a one-week relief before resuming the Tariff Crash. The full analysis is below.
Essential Tools to Navigate this Market: During this period, while many celebrated Holy Week and Easter, I released two essential publications. The first presents the single metric that has timed bear market bottoms for decades. The charts speak for themselves; there is no gut feeling involved. This is data every investor and trader must be aware of.
The second publication provides the Support and Resistance Levels for next week and the month of April. These levels have proven to be an accurate “bullish above / bearish below” threshold. The indices must consolidate above them next week before we can consider any further bullish continuation.
Today’s Agenda
The Momentum Map: Analyzing the stage of every security in a single chart.
Setups Blueprint: Entry levels for short and long setups with price targets and invalidation levels for all the securities in the watchlist prioritizing stronger setups.
Market Context: Technical charts and price levels for U.S. Indices, Volatility, Breadth, and Crypto.
Deep Dive: Individual analyses for Metals and Mega Caps.
Upgrade your subscription to the paid plan; unlock the full content with charts, price levels and most probable setups for next week.
Momentum Map
Few times the momentum map anticipates this many opportunities in the market: