
Make or Break: Oversold Conditions Meet a Broken 200DMA
Navigating oversold levels with high uncertainty - Key levels to monitor during the week

The Federal Reserve held its benchmark rate steady at 3.5% to 3.75%. Chair Jerome Powell acknowledged inflation progress but cited Middle East developments as a source of deep economic uncertainty. Rate cut expectations for 2026 have been largely priced out. The higher for longer environment weighed on utilities and technology. Micron Technology fell nearly 4% after third-quarter guidance missed expectations. In crypto, Bitcoin briefly decoupled from equities to reclaim $74,000 on Monday before institutional selling renewed pressure through the week.
If you missed the latest special about oil and stagflation, including a long term study of major tops in the stock market, make sure to read it, this is essential for long term investors and traders.
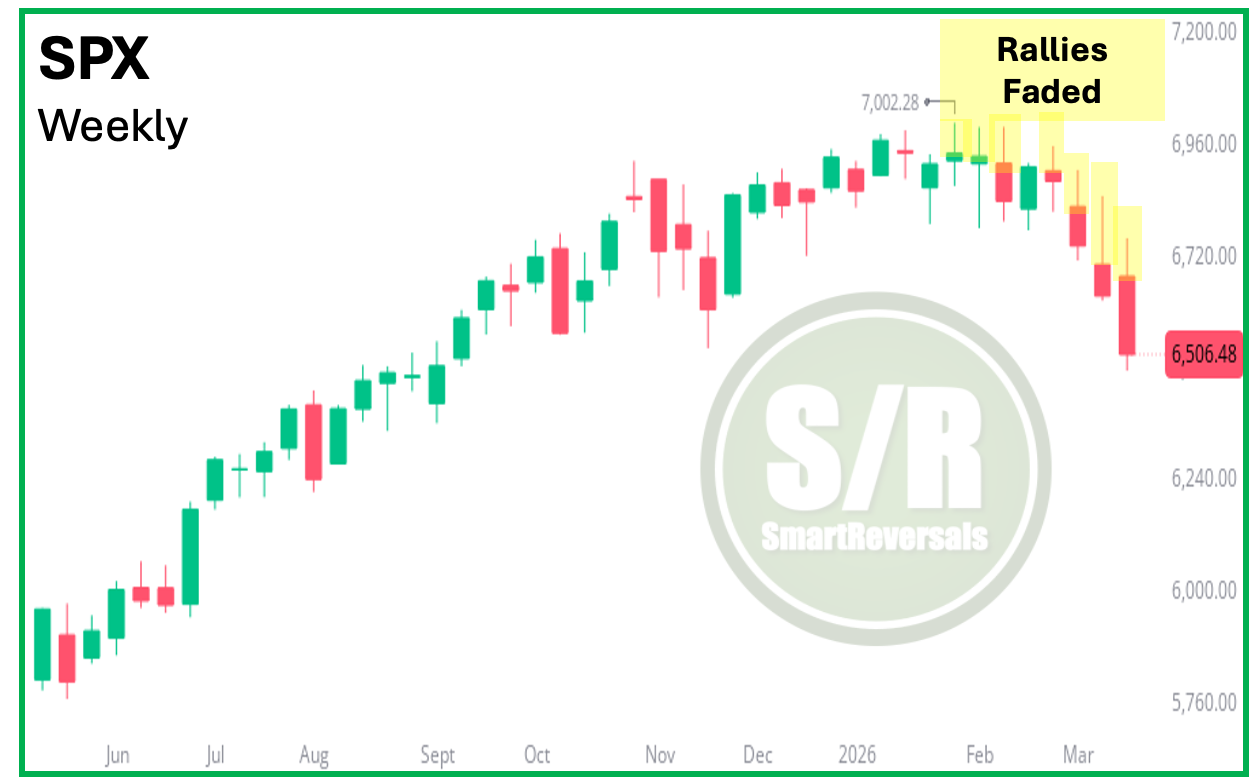
This week saw yet another faded rally. We are hitting oversold levels that look promising on Friday and Monday, yet every attempt to bounce is sold off. Unlike previous weeks, this time the bears showed real conviction. The defensive sectors continue reversing.
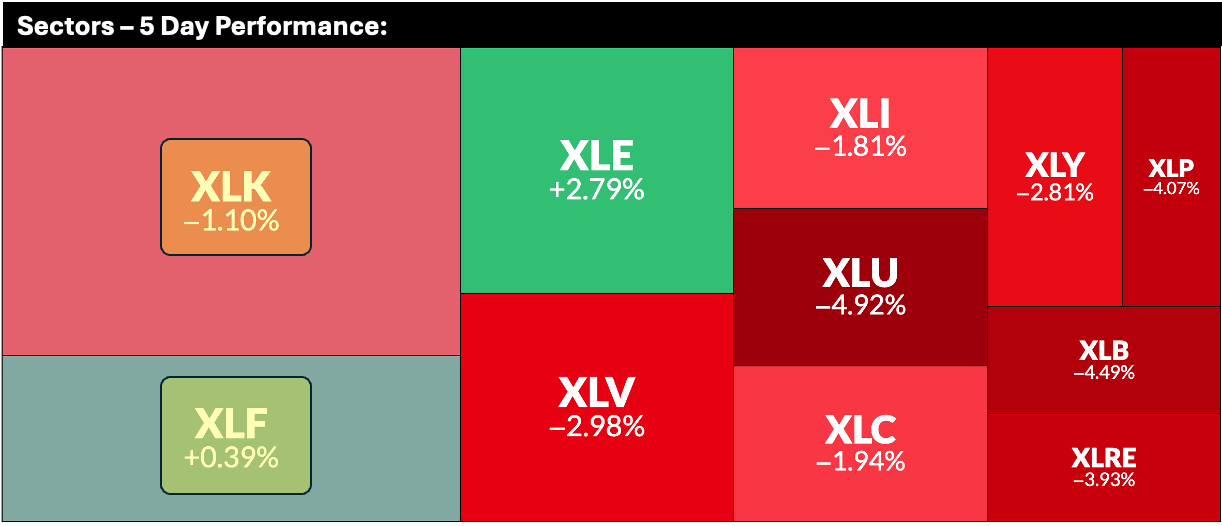
You may recall my special reports on sector rotation (Wednesday is the day for Market Intelligence), where I highlighted that defensives were overbought while growth was oversold. By the time the “Great Rotation” became a popular media topic, the move was already largely complete. Over the last several weeks, Industrials, Staples, Materials, and Healthcare have fallen sharply, with Utilities joining the defensive sell-off this past week. While the week was undoubtedly bearish, Technology and Financials showed relative strength, following only Energy in performance.
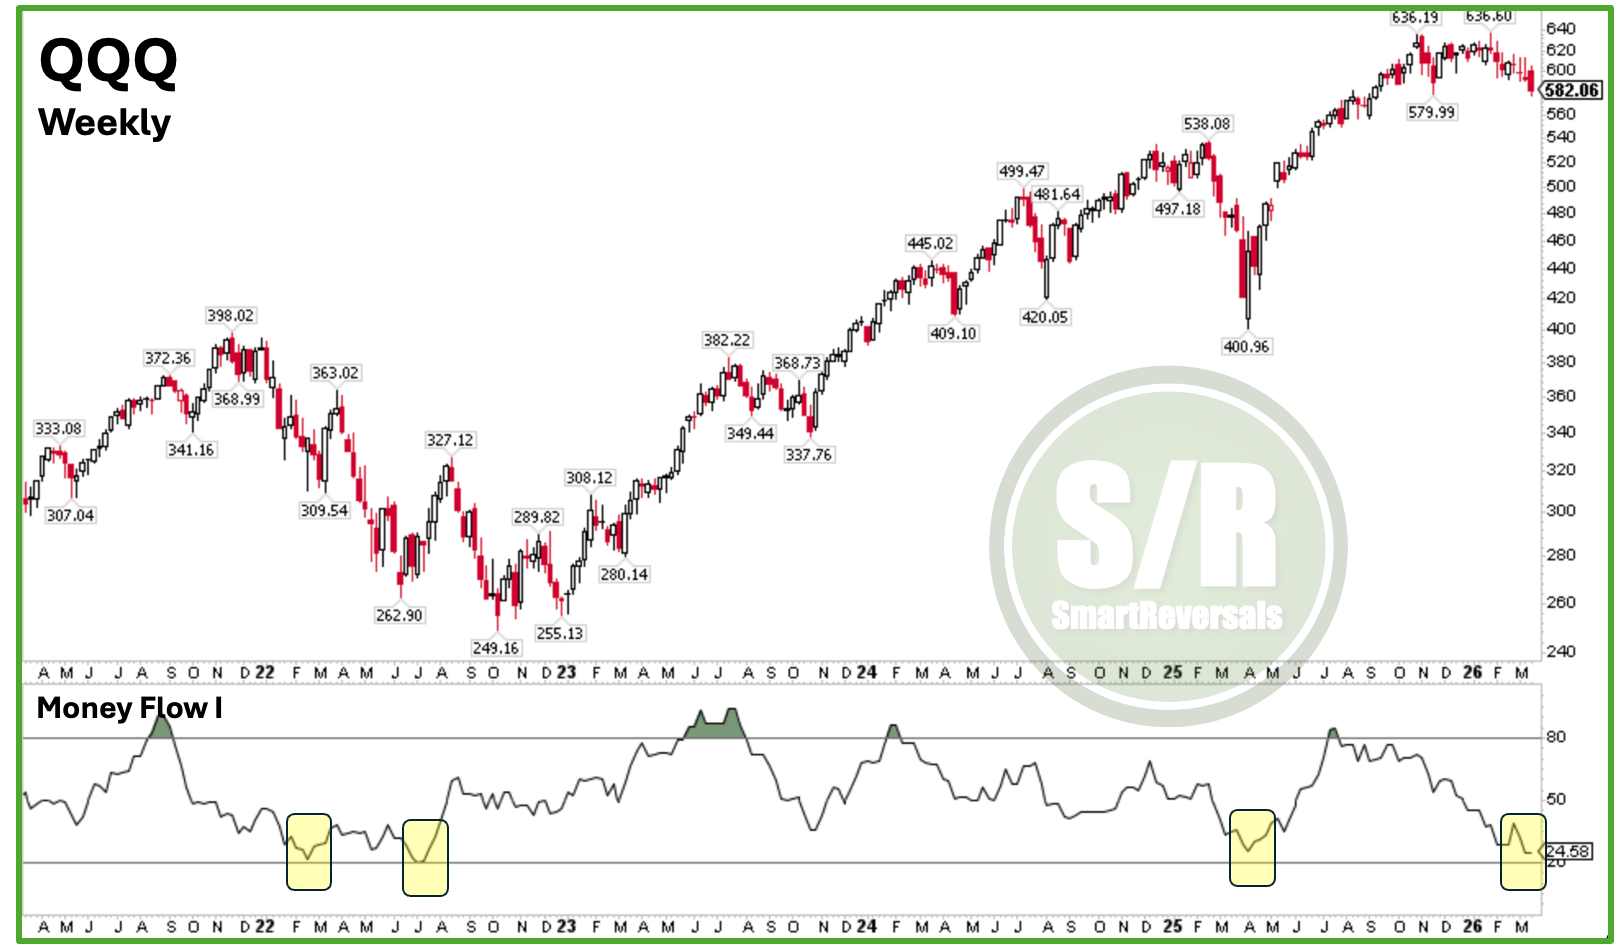
It is worth noting that the QQQ has reached extreme oversold levels. Based on Money Flow, the index is currently below its 2025 bottom, the 2023 correction, and even the lows of the 2022 bear market. The current reading coincides with the rallies that began in March and June of 2022. While that was a bear market year, we must navigate the immediate price action, and the current scenario suggests a bottom is near.
Today we will focus the analysis on the technical indicators that are flagging oversold conditions, the levels that have been breached recently, like the 200 daily moving average in the case of the S&P500, Dow Jones, and Nasdaq 100. weekly timeframes that removes the noise of the daily volatility, and essential support and resistance levels to watch, including the central weekly level for all the securities studied. Any spike must recover that level, that lately has essentially acted as a resistance during the last weeks.
The Geopolitical “Time vs. Price” Factor: The reason I emphasize that the bottom is near in terms of Time rather than Price is the unpredictability of war. Unlike economic data or earnings reports, geopolitical events do not follow a schedule.
Since 1939, the S&P 500 has bottomed approximately 15 trading days after a major geopolitical event. That statistic, combined with current extreme oversold conditions, is the focus of today’s study, including the key price levels each security must recover to validate a sustainable bounce if it happens, so you don’t jump in buying a falling knife. Our Central Weekly Level (CWL) remains the definitive momentum validator; for over two years, it has proven to our subscribers that price action is bullish above and bearish below.
The distance to this central weekly level, or the “spike” required next week, varies by security. For instance, META must jump 2% to validate any recovery; otherwise, we likely face another “vanishing” move. SLV has crashed and now needs a bounce of more than 6.4% to prevent the sell-off from resuming. Conversely, AAPL is just 0.7% away from flipping its key level to support, which would complete a 2.2% move, while JPM is only $1 away from the level needed to spark a bullish reversal.
The combination of technical indicators and modeled support and resistance levels helps us navigate this market. By staying aware of volatility, index momentum, and sector variables, we provide the roadmap necessary for the week ahead. Unlock the full analysis below.
The securities constantly analyzed by this publication are the following ones:
Indices & Futures: SPX, NDX, DJI, IWM, ES=F, NQ=F
ETFs: SPY, QQQ, SMH, TLT, GLD, SLV, DIA, VXX
Megacaps: AAPL, MSFT, GOOG, AMZN, NVDA, META, TSLA, BRK.B, LLY, WMT, AVGO, COST, JPM, XOM, PLTR, NFLX, V, AMD
Crypto & Related: Bitcoin, Ethereum, ETHA, IBIT
Leveraged ETFs: TQQQ, SQQQ, UDOW, SDOW, UPRO, SPXS, URTY, SRTY
If you invest or trade one or more of these securities, this publication is for you.
Today’s Agenda
The Momentum Map: Analyzing the stage of every security in a single chart, identifying momentum and potential bullish or bearish reversals.
Setups Blueprint: Entry levels for short and long setups with price targets and invalidation levels for all the securities in the watchlist prioritizing stronger setups.
Market Context: Technical charts and price levels for U.S. Indices, Volatility, Breadth, and Crypto.
Deep Dive: Individual analysis of Metals and Mega Caps (20+ charts).
Let’s begin.
Momentum Map: Technicals Always Pass their Bill
Over the past months, we have observed a consistent rotation across securities, regardless of the prevailing bullish or bearish momentum. This was clearly evidenced when AAPL and TSLA transitioned through the map, moving from Laggard to Improving, and finally to Leading, yielding double-digit rallies consistent with our technical readings. We saw the same cycle play out with LLY, GOOG, and much earlier with PLTR, NVDA, and NFLX, as they followed the circular “clock” rotation before eventually falling into Weakening and Laggard status.
Currently, we are seeing this shift in SLV. This silver-tracking ETF has finally exited the Leading quadrant. This observation is primarily educational, highlighting the critical importance of following technical signals and the Central Levels (Weekly or Monthly depending on your profile) to stay ahead of the map’s rotational shifts.
Let’s talk about the current opportunities in the map: