
Market Divided: 4 Hindenburg Omen Triggered but Hammer Forms
Major warning signal and a buy one at the same time.


The Shooting Star patterns highlighted last week proved their worth as critical warning signs, reinforced by overbought oscillators and the gaps marked in this publication’s charts. Price action confirmed the warnings, the market opened the week below the central weekly levels for QQQ ($630) and IWM ($247); the SPY briefly jumped above its central level of $683 on Monday before failing, NVDA lost $201 on Tuesday, and MSFT stayed well below $528 validating bearish momentum.
This bearish setup was true for many individual securities analyzed here last weekend. Conversely, other securities showing signs of consolidation, like GLD and SLV, managed to recover their central weekly levels of $366.6 and $43.4 respectively, validating the bounce potential described last Sunday based on volume profile and annual Support/Resistance (S/R) levels.
We also saw bounces in BRK.B following its strong earnings and an oversold daily chart mentioned last Sunday. Furthermore, already oversold stocks like META and NFLX are now consolidating in a narrow range. These two were my fundamental analysis priority, allowing those seeking entry points to assess the long-term sustainability of the recent selloff drivers. My full analysis and price targets are available in these publications:
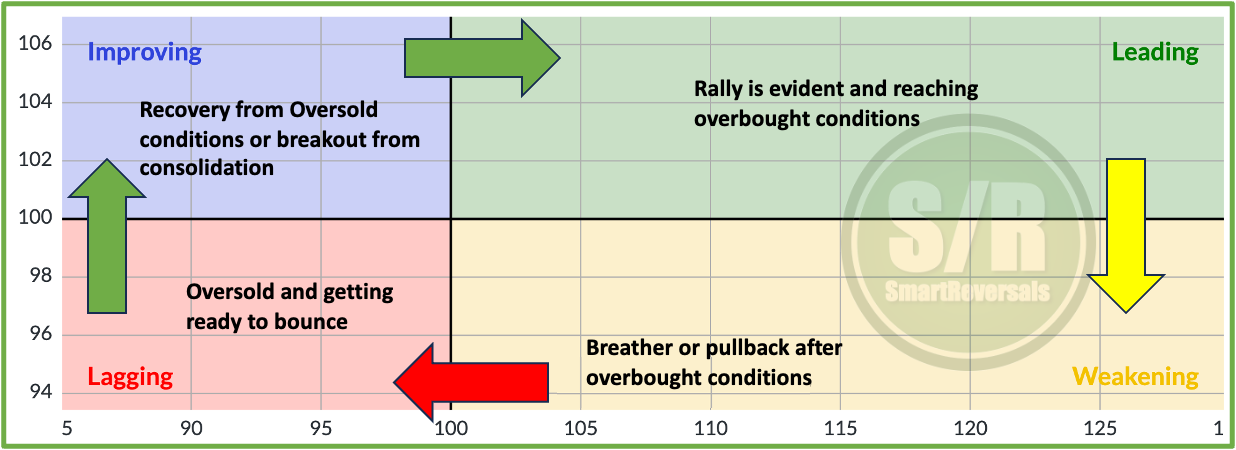
During the last two weeks I have mentioned the importance of analyzing individual securities, considering the internal rotation happening in the indices, where some sectors or companies are bouncing from oversold levels while overbought ones are finally declining. For that reason the Momentum Map helps watching all the securities in one chart identifying which ones are oversold (red quadrant), which ones are warming up (blue) and bouncing already, others in bullish momentum (green), in extreme cases getting overbought conditions, and others in consolidation or pullback process (yellow).
For a practical reference, let’s see some of the securities analyzed in this publication and their evolution in the Momentum Map:
ETH was roaring in the leading (green) quadrant eight weeks ago, reaching severely overbought conditions, similar to BITCOIN. As we highlighted back then, Bitcoin’s overbought status was clearly signaled by technicals like Bollinger Bands and the annual resistance level of $124K (a level visible in our charts since April 2025). Since then, ETH has fallen to the “weakening” area and is now reaching oversold conditions.
Conversely, BRK.B bounced from the oversold conditions mentioned last Sunday based on the daily chart and its earnings report, a setup perfectly consistent with the Map’s red quadrant.
On a more developed bullish reversal front, premium subscribers have witnessed the full evolution of AAPL and TSLA: moving from the oversold conditions called out in this publication to establishing bullish momentum, and now entering a period of consolidation.
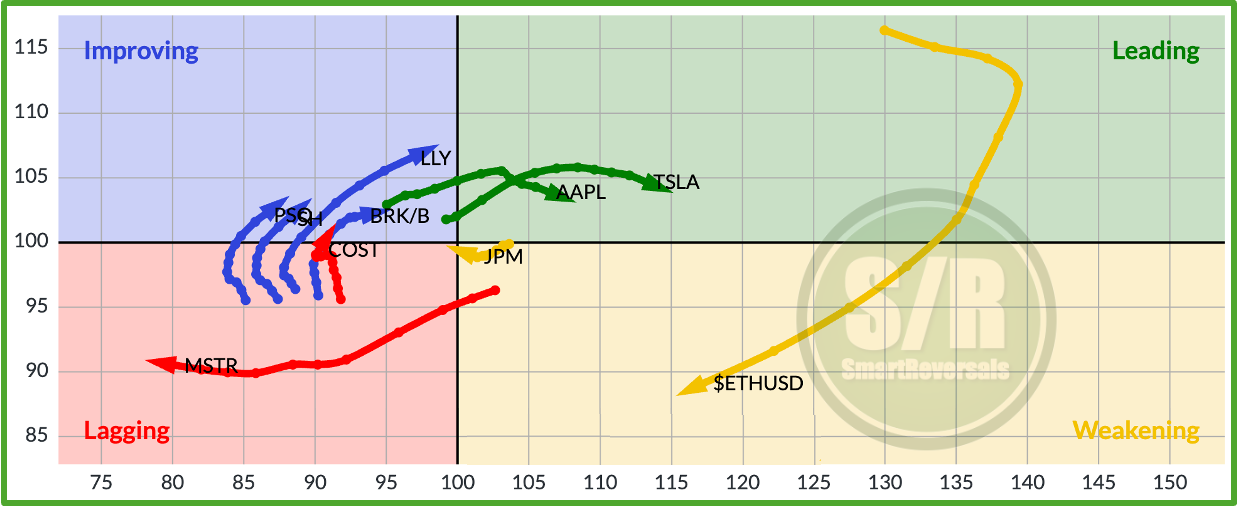
Our combined approach—enriching technical indicators and momentum analysis with Support and Resistance (S/R) levels—provides clarity, with a simple “bullish above and bearish below” framework for navigating securities. Both LLY and COST are included in the current S/R levels edition. Finally, inverse ETFs like SH and PSQ (which move opposite to SPY and QQQ, respectively) were oversold and are now bouncing, moving cyclically through the Map’s quadrants.
Upgrade your subscription to the paid plan today. Unlock the Momentum Map featuring all the securities analyzed in the S/R levels, plus access the complete technical charts and price targets for next week.
This publication consistently analyzes the following securities to provide a broad market perspective and empower your trading decisions:
Indices & Futures: SPX, NDX, DJI, IWM, ES=F, NQ=F
ETFs: SPY, QQQ, SMH, TLT, GLD, SLV, DIA, SH, PSQ
Major Stocks: AAPL, MSFT, GOOG, AMZN, NVDA, META, TSLA, BRK.B, LLY, WMT, AVGO, COST, JPM, PLTR, NFLX
Crypto & Related: Bitcoin, ETH, IBIT, MSTR
Leveraged ETFs: TQQQ, SQQQ, UDOW, SDOW, UPRO, SPXS, URTY, SRTY
Let’s begin with the SPX analysis, then we continue with the Momentum Map with all the securities included, trade opportunities, and then you can read the individual setups to have a broad view of the best opportunities among these key securities.
SPX - Hindenburg Omen Or Oversold Conditions?
The chart below shows for the last 17 years the number of Hindenburg Omen occurrences and the following pullbacks, corrections, or bear markets in for the SPX. The conclusions below provide context for the current market structure based on the weekly SPX chart.
We studied last Sunday the H.O. occurrences, the updated list is here:
2013: 10 signals related to pullbacks
2014: 6 signals before flat consolidation
2015: 3 signals before a significant correction
2017: 3 signals related to mild pullbacks
2018: 13 signals during two moments, one correction, one bear market
2019: 5 signals related with pullbacks
2020: 5 signals before the market crash
2021: 3 fragmented signals, before the 2022 bear market