
Market's Clock: It's Not a Matter of "If," But "When"
Navigating the Path to Volatility - 20 Assets Analyzed including U.S. Indices, Megacaps, Bitcoin, Metals, and ETFs

Last week, this publication considered an intra-week rally that would fade, and that is what happened in the stock market. A strong rally on Monday faded day by day until a Friday bounce recovered the central weekly level for the indices. However, a weekly indecisive candle was printed, a formation that has been consistent with the initiation of consolidations or pullbacks.
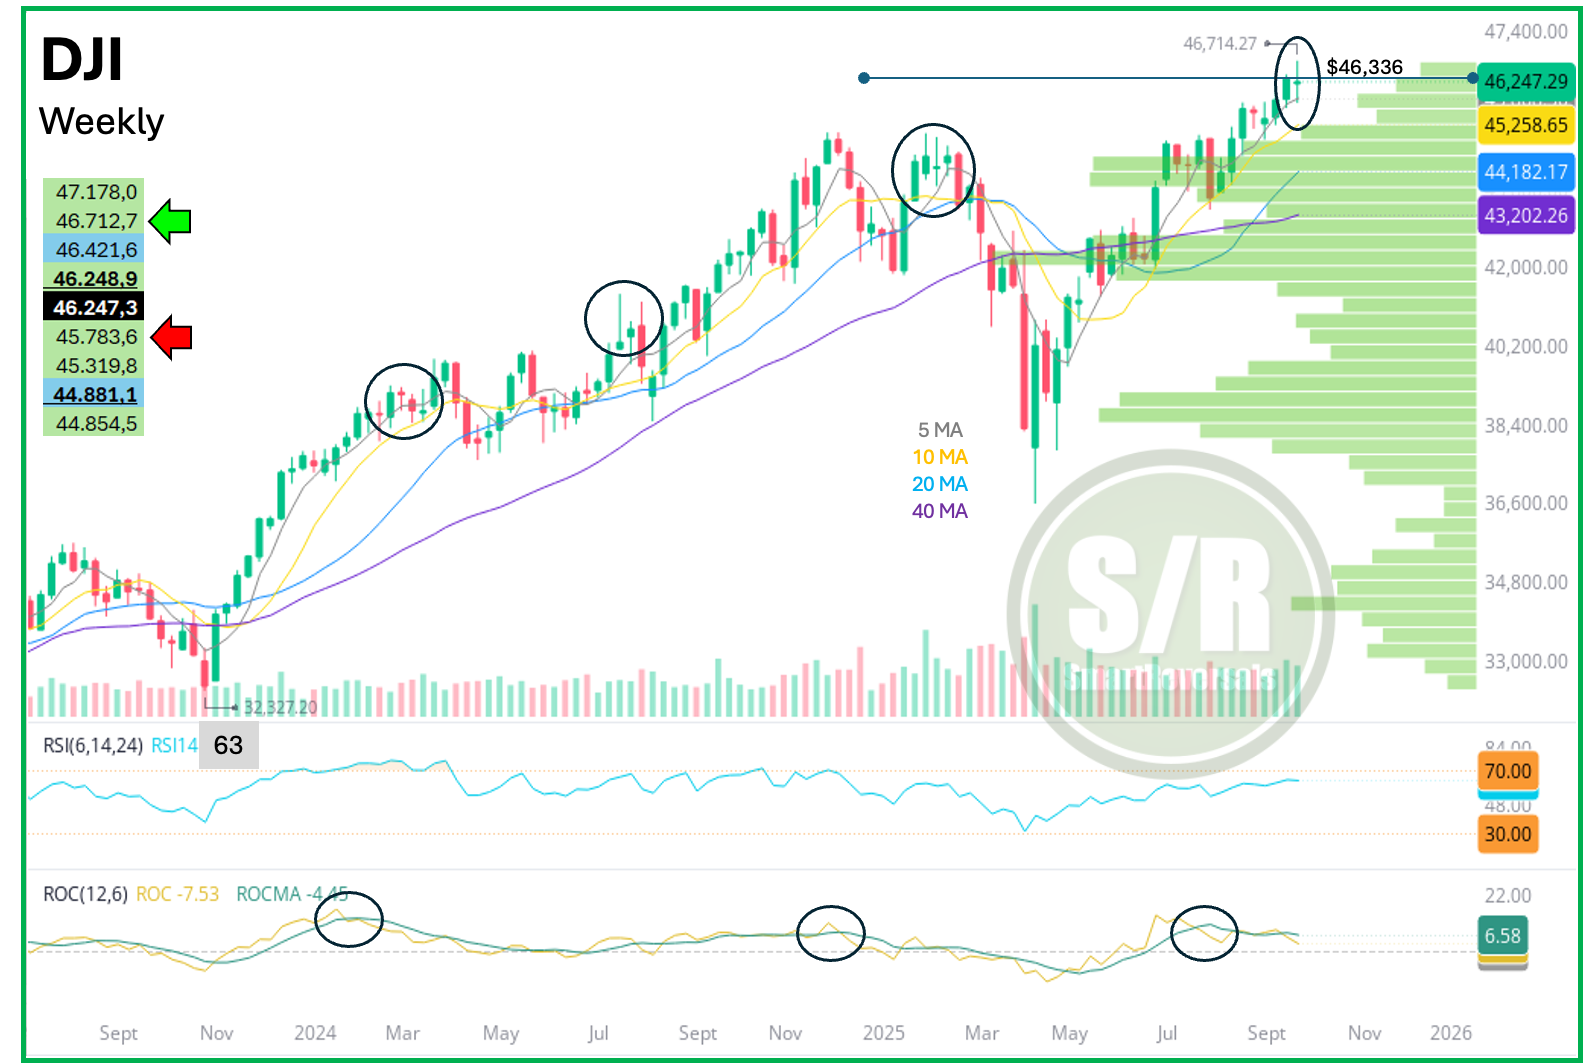
The indices closed with an indecisive candle that has preceded consolidations or even pullbacks, as the Dow Jones currently shows in the chart below. The Rate of Change (ROC) has been diverging from the price for a couple of weeks, which is perfectly normal after a parabolic rally and has also preceded pullbacks a couple of weeks later.
The Dow Jones reached the annual target that had been on my charts since April/May ($46,336). At the time, this seemed extreme, but after only five months, the target has been reached. These annual levels can bring turbulence, as premium subscribers observed during three weeks in August and the beginning of September when $6,486 was reached for the S&P 500 and $23,654 for the Nasdaq 100.
Today, the “godfather of the indices” printed indecision at the “pending to reach” annual level, suggesting caution for the days ahead. As usual, the key support and resistance levels are included at the left of each of my charts. For next week, the price must recover and stay above $46,249 to consider any temporary bullish continuation. $46,421 could set significant resistance, as it is a monthly level. If the index continues below the central level, the minimum destination is $45,783, which still looks likely given other factors that are studied in the premium section below.
Volatility, small caps, stock participation, crypto, and several megacaps are all raising key flags to watch. We will decode the technicals and specific price levels for these assets in the sections below.
Two weeks ago, we studied the current stage of the bull market using specific patterns that have proven to be a successful approach to navigating the medium term. This methodology worked when I anticipated a visit to $4,800 for the S&P 500 in January (the low was $4,835) and when I forecasted $6,486 in April/May during a time of market panic. The numbers and charts are crystal clear, and if I had to choose the main publication of September, this would be the one, please read it, and see where this market is heading (spoiler alert: I’m bullish for the coming months, what we’re monitoring very short term is the imminent pullback)
This publication analyzes a set of securities every week, providing a rotational menu of alternatives as momentum changes. For example, three months ago, NFLX was showing clear signs of a pullback after a parabolic rally, and two months ago we called the top for MSFT. Last month, PLTR brought signs of a top after a similar move, and today GOOG is showing signs of obeying gravity, just as the others did at different times.
On the bullish side, I have been bullish on TSLA for the last three weeks, and today its chart presents a special pattern analysis that the Tesla enthusiasts don’t want to miss. A bottom for BRK.B was called two months ago, WMT was added at the moment of its bottom a month ago, the bullishness of GLD and SLV has been studied (the $345 target for GLD was reached this week), and the analysis for AAPL has highlighted the stock’s bullish momentum.
These are concrete examples of how you can benefit from a constant panel of stocks, each with specific target prices, invalidation lines, and support and resistance levels. Last but not least, BITCOIN fell this week as expected according to its technical chart last week, a significant aspect to consider even for the stock market.
Today’s agenda includes the following charts as usual: SPX, VIX, NDX, Dow Jones, IWM, SMH, GLD, SLV, WMT, BRK.B, PLTR, NFLX, GOOG, AAPL, TSLA, NVDA, META, MSFT, AMZN, and Bitcoin. If you trade some of those securities, or you are seeking for a set of solid and differentiated assets to monitor, this publication is for you. (Notes for SPY, QQQ, and DIA are also here)
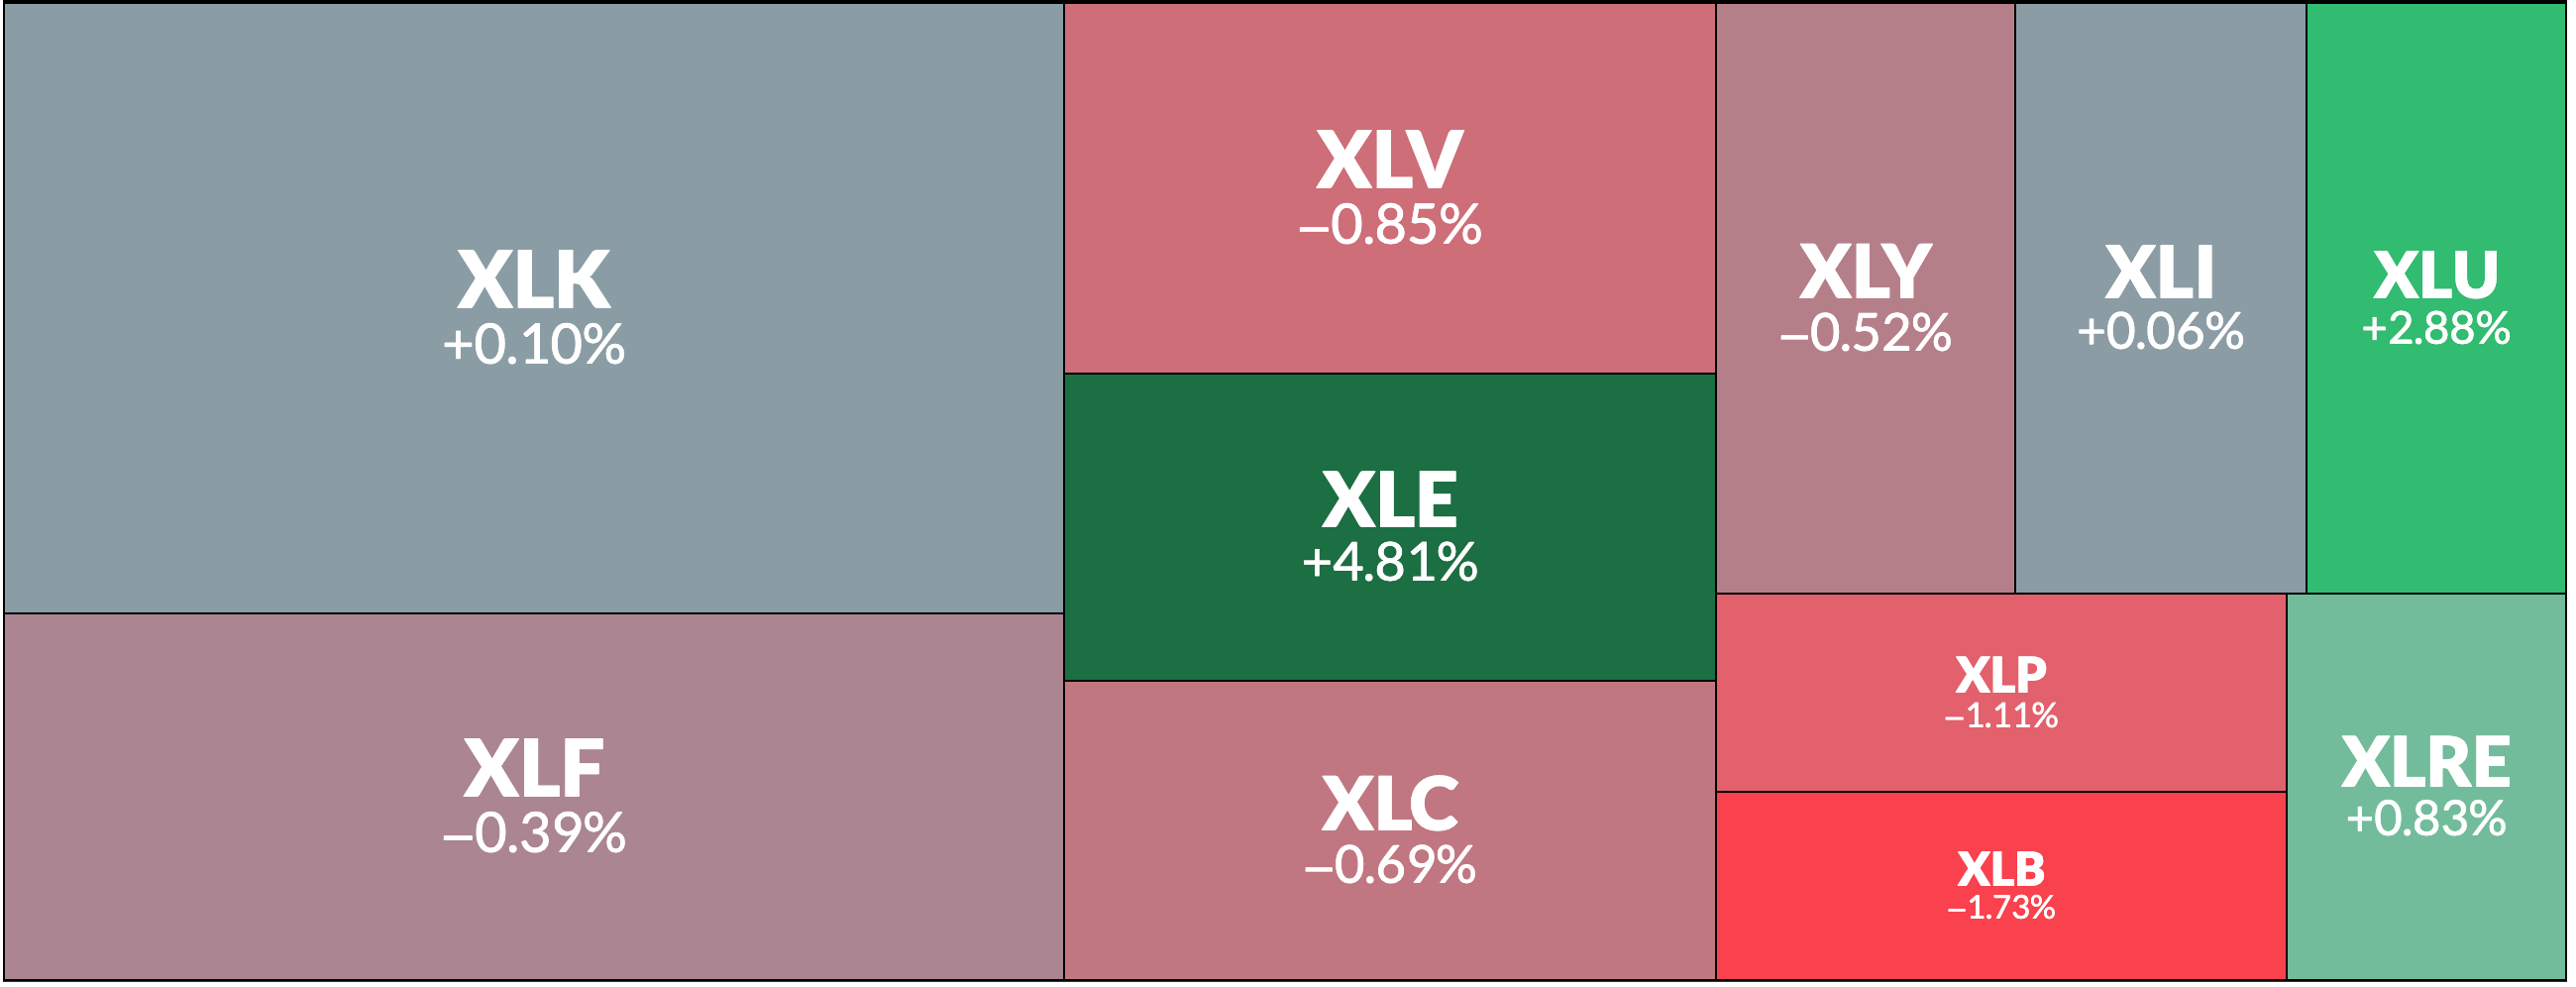
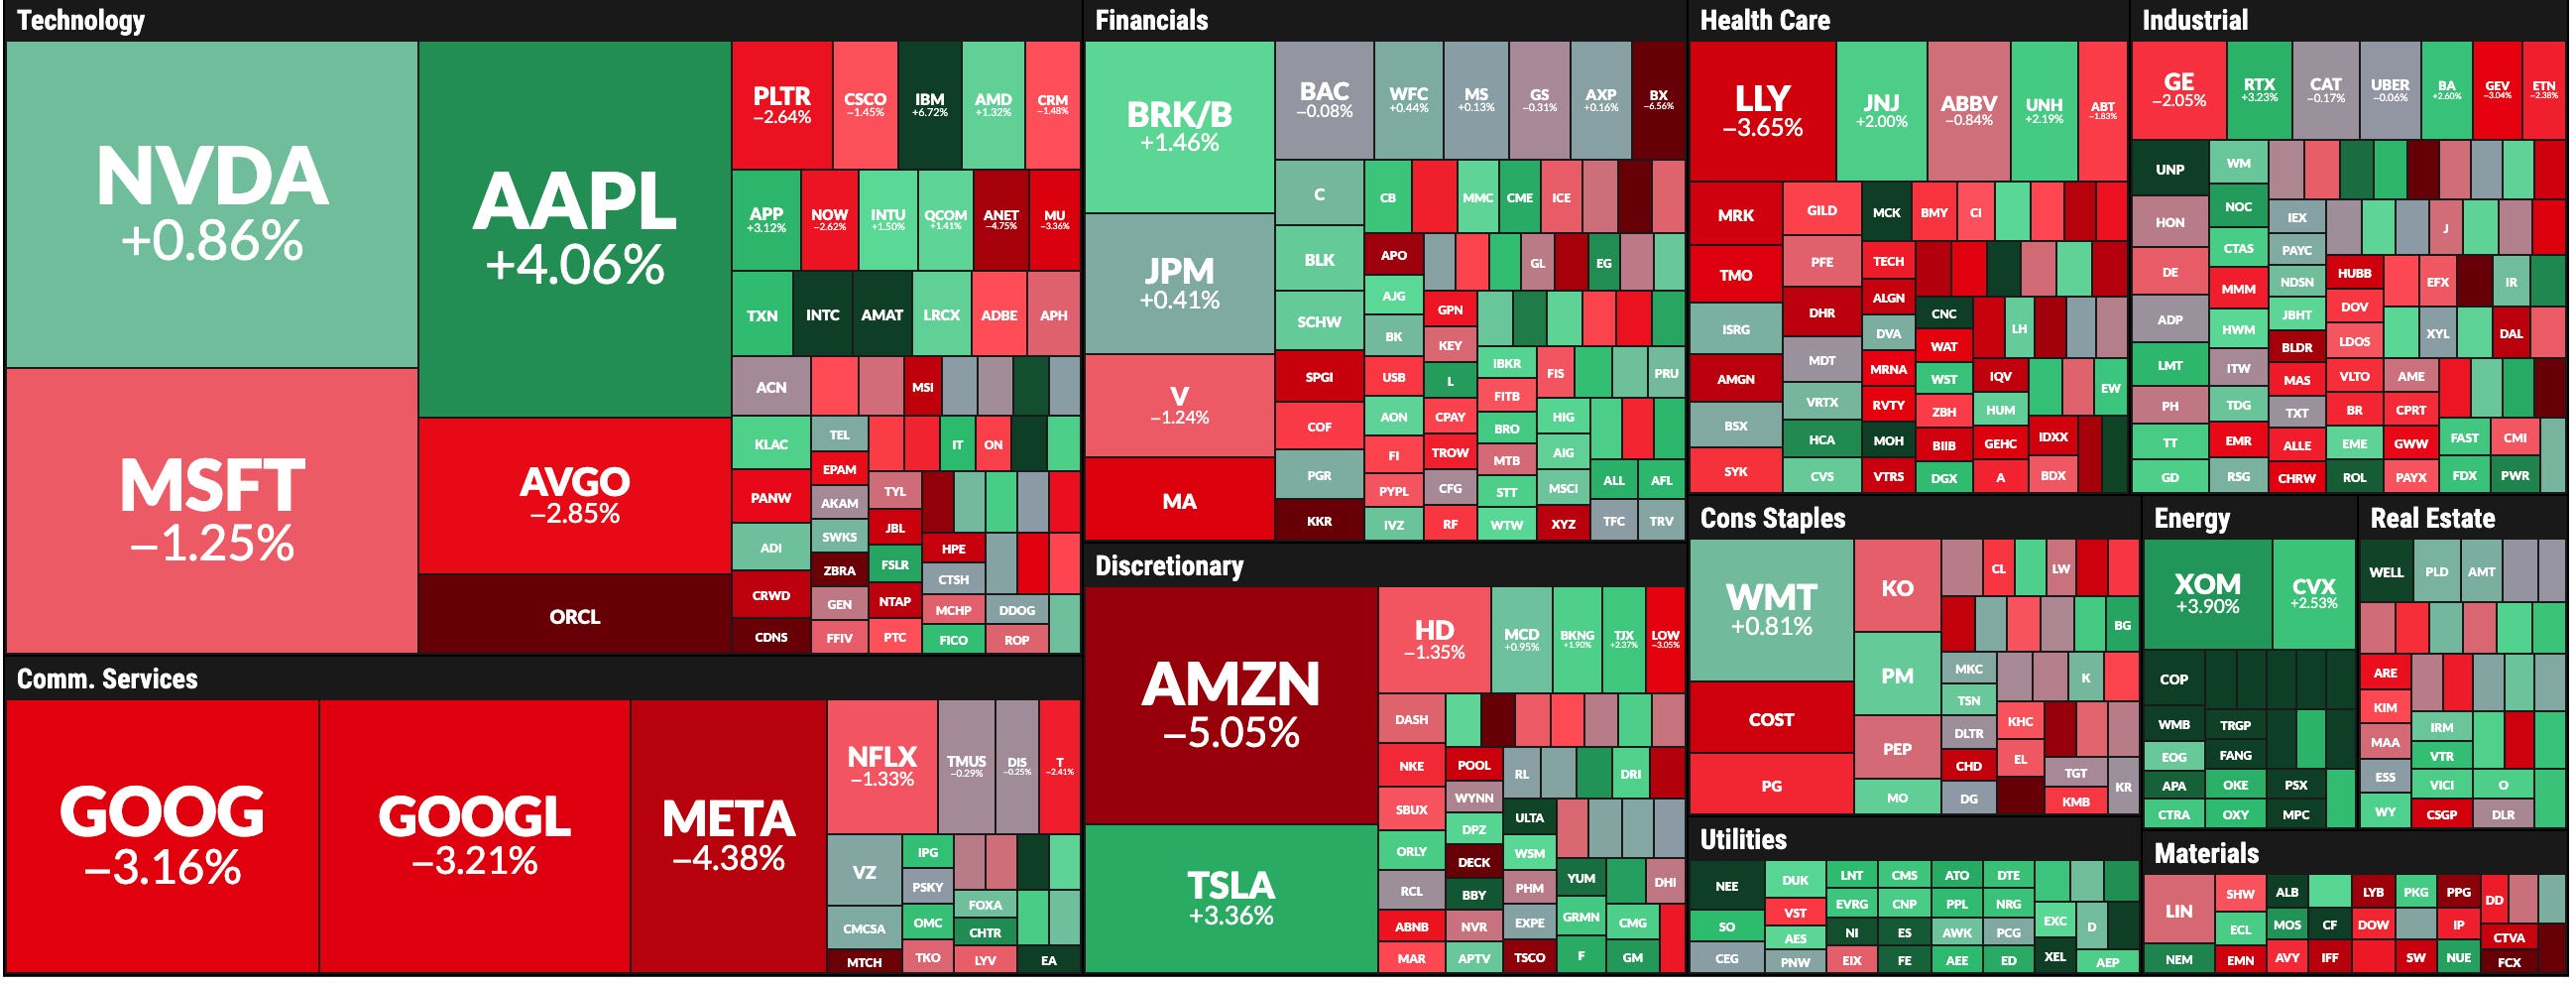
Sectors and SPX Components - 5 Day Gains
We’ve seen a clear rotation in the market over the last few weeks. While the previous one was driven by tech and broad participation, the week that just ended showed significant differences across sectors. Energy and Utilities kept the market afloat, materials fell, while other sectors remained neutral. The tech sector was moved almost entirely by AAPL and TSLA, as GOOG, META, AMZN, and ORCL fell significantly. All of these moves were expected, with the exception of META. However, for disciplined investors who used the central weekly level of $773.8 as a reference to invalidate a bullish thesis, a 2% drawdown was successfully avoided (I always provide the essential level that works as insurance when a setup is invalidated).
ORCL is a company that I posted in my social feeds, it is slowly filling its gap with a -8,2% weekly correction. People who chased the euphoria and bought at $345 have suffered a -18% hit, that’s why technical indicators are key.
I’m giving away my eBook about technical indicators as an appreciation to your subscription, the first six sections are for everyone and will be provided every Sunday, today’s weekly update comes with three sections: Candlesticks, Oscillators (RSI, Stochastic), MACD), and Bollinger Bands.
Make sure to read the S/R Levels for the week ahead, the weekly chart for SPY is open for everyone, and this publication has the macro-observations considering the recent economic data released, it’s open for everyone, click here for access.
S&P 500 (SPX) - Not a Matter of “If,” But “When”
The latest weekly candle has anticipated pullbacks without exception during the last years, sometimes the decline happens immediately in a mild fashion, in other cases it comes 1 or 2 weeks after the indecision with more bearish conviction. The sooner the better for bulls, and the VIX as presented below shows an indicator that provides a reference of timing.