Two weeks ago, we studied the different instruments to invest in the stock market and crypto space, understanding 10 of them and their intrinsic characteristics including the level of volatility. Some of those instruments present high volatility, allowing investors to accelerate their gains but also potentially their losses if there is not proper technical knowledge and risk management.
Last week, I posted a guide to manage short timeframes using a set of technical indicators combined with the support and resistance levels published every Friday.
Today's publication concludes our series on the advanced use of Support and Resistance levels. This final installment focuses on combining these levels with other indicators on shorter timeframes, making the content highly relevant for active and high-frequency traders.
To access the previous two publications, click here:
All the content on SmartReversals.com, including the links to the publications mentioned and this guide, can be unlocked with the premium / paid subscription.
Let’s begin.
What is an Option and How to Use It?
An option is a contract that gives the buyer the right, but not the obligation, to buy or sell an underlying asset (like a stock) at a predetermined price on or before a specific date.
The key phrase here is "right, but not the obligation." For the U.S. stock market this means you can choose to use the contract or let it expire worthless. You are not forced to buy or sell the stock.
Every option is either a "call" or a "put."
Call Option (A Bullish Bet 🐂) A call option gives you the right to BUY a stock at a specific price. You buy a call when you believe the price of the stock is going to go up.
Put Option (A Bearish Bet 🐻) A put option gives you the right to SELL a stock at a specific price. You buy a put when you believe the price of the stock is going to go down.
Key Components of an Options Contract
Every options contract has four main parts:
Underlying Asset: The stock or ETF the contract is based on (e.g., Apple stock, or the SPY ETF). The examples provided today include NFLX, HOOD, SPY, TSLA, QQQ and SPX as some securities commonly traded nowadays.
Strike Price: The fixed price at which you have the right to buy (for a call) or sell (for a put) the asset.
Expiration Date: The date the contract expires. If you don't use or sell the contract by this date, it becomes worthless.
Premium: This is the price you pay to purchase the option contract. As a buyer, this is the maximum amount of money you can lose.
(Note: One options contract typically represents 100 shares of the underlying stock.)
A Simple Example: Buying a Call Option
Let's say a stock, "XYZ Corp," is currently trading at $100 per share. You believe it's going to rise in the next month. Instead of buying 100 shares for $10,000, you decide to buy a call option.
You buy one call option contract with a strike price of $110 that expires in one month. The price (the premium) for this contract might be $2.00 per share, so your total cost is $200 ($2.00 x 100 shares).
Scenario 1: You are right. The stock price jumps to $120. Your option, which gives you the right to buy the stock at $110, is now very valuable. The premium might increase to $10.00 ($1,000 per contract). You can sell your contract for a profit of $800 ($1,000 sale price - $200 cost). This illustrates the leverage of options.
Scenario 2: You are wrong. The stock stays at $100 or goes down. Your option to buy at $110 is worthless, and the contract expires. You lose the $200 premium you paid, and nothing more. This illustrates the defined risk.
Option Chains and Essential Indicators
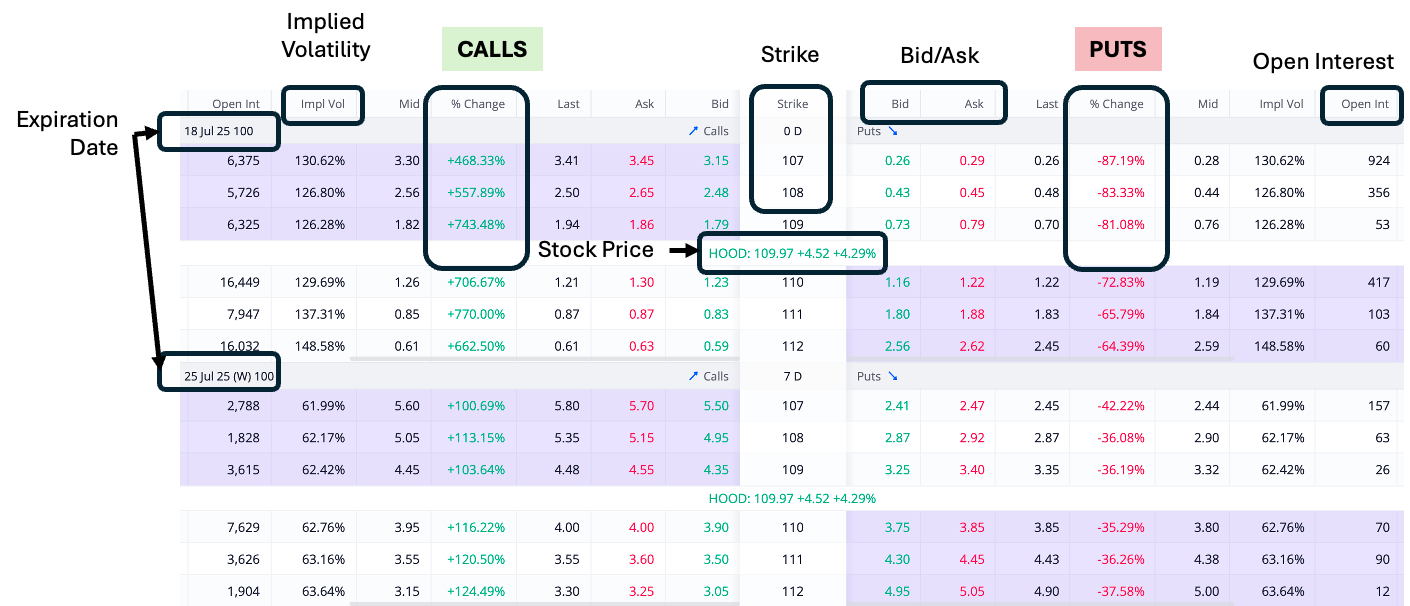
There are key indicators to consider when analyzing an option chain, let’s use this example for HOOD:
Strike Price: In an options chain, you will see a long list of different strike prices for a stock. Your choice of strike price depends on your forecast. If you think a $100 stock will go up, you might buy a call option with a strike price of $110. The strike price is essentially the "deal price" that you are locking in with your contract.
See for the HOOD example, how the call options jumped when the stock rallied +4% last Friday; people who were right gained over 400% for the options expiring on Friday, July 18th. People who were wrong saw losses from -60%. This is a real and fresh example of being right or wrong when volatility is high for the underlined stock. The gains and losses vary depending on the price strike, expiration date, and other factors studied below.
Expiration Date: In an options dashboard, the "date" you see is the . It is the specific day on which an options contract becomes void. It is the absolute deadline for the owner of the option to exercise their right to buy or sell the underlying stock. If they don't, the contract expires worthless. An options dashboard will show you many different expiration dates for the same stock. You might see options that expire every week ("weeklies"), every month ("monthlies"), and even further out with quarterly or yearly expirations ("LEAPs"). The main "difference" between them is time:
An option that expires in one week has very little time for the stock to make a favorable move, so it could be relatively cheap.
An option that expires in six months has much more time for your prediction to come true, so it could be much more expensive.
This "time value" is a key component of an option's price (its premium).
Open Interest: This is the total number of outstanding contracts that have not been settled. This number is calculated by the options clearing corporation overnight. So, while you see it on the same dashboard, its value only changes once per day, typically before the next trading session begins. It is different from volume, which is the number of contracts traded on a given day.
High Open Interest: A large number of open contracts indicates a high level of interest and participation from traders at that specific strike price. This is generally a positive sign because it means the option is liquid, making it easier to buy and sell at a fair price without a large bid-ask spread. High open interest levels can also act as psychological support or resistance levels for the stock.
Low Open Interest: A small number of open contracts signifies little market interest. These options are illiquid, and it may be difficult to trade them efficiently.
Changes in Open Interest: If open interest is increasing day-over-day, it means new money is flowing in and new positions are being opened, which can confirm the strength of the underlying price trend. If it's decreasing, it means positions are being closed, which could signal a trend is losing steam.
The constant flood of buy/sell orders for the option changes the Bid and Ask prices in real-time. This real-time change in the option's price instantly changes the calculated Implied Volatility. "Last" and "Change" update as trades happen. The only one that is not part of this real-time update is Open Interest, which is a daily, backward-looking statistic.
Implied Volatility (IV): This metric is calculated from the option's current price. IV is not an independent number; it is the market's expectation of future volatility as implied by the current premium (the price between the bid and ask). Therefore, as the Bid and Ask prices change, the IV is instantly recalculated. If traders suddenly start paying more for an option (driving up the bid/ask), the IV will go up, even if the stock price hasn't moved.
High IV: A high IV means the market is expecting a large, sharp price swing in the near future. This makes the option more expensive (inflates the premium) because there is a greater chance of a big move. High IV is common before major events like earnings reports, major announcements, or during a broad market bounce or panic.
Low IV: A low IV means the market expects calm, stable price action. This makes the option cheaper, as the probability of a large price move is considered low.
Example: How to Decipher a 130% Implied Volatility?
Based on the example presented above, see the implied volatility for the strike prices expiring on July 18th. A specific IV percentage gives you a statistical expectation of future movement.
What it Means: An implied volatility of 130% is extremely high. In statistical terms, it means the market is pricing in a potential for the underlying stock's price to move up or down by 130% from its current price over the next year (with a 68% confidence level, representing one standard deviation).
How to Decipher It for Trading: While the annual figure is the standard, traders break it down into shorter timeframes. A simple rule of thumb is:
An IV of 130% means the market is expecting extremely large, sharp, and potentially explosive price swings.
You would typically see this level of IV on highly speculative cases, including:
Growth companies with significant business prospects
A biotech company awaiting crucial trial results.
A "meme stock" during a period of extreme social media hype.
A company that is a potential buyout target.
This high IV makes the options very expensive and very risky. While the potential for profit is massive if you are correct, the option's premium will decay very quickly if the expected big move doesn't happen.
Bid, Ask, Last, and Change: These are the most direct results of trading activity.
Bid: The highest price a buyer is currently willing to pay.
Ask: The lowest price a seller is currently willing to accept.
The Bid and Ask prices change constantly—every millisecond—as traders place, cancel, and modify their orders. The "Last" price only updates when an actual trade is executed (when a buyer and seller agree on a price). "Change" is simply the difference between the "Last" price and the prior day's close.
Major Risks to Understand
Their high volatility is what makes them both incredibly powerful and inherently risky.
The primary reason options are so volatile is a combination of inherent leverage and their sensitivity to several dynamic factors, not just the stock's price alone. Let's break down the key drivers:
1. Inherent Leverage (The Biggest Factor)
Leverage is the main reason for the dramatic price swings in options. An option contract allows you to control a large amount of stock value with a relatively small amount of money (the "premium"). This creates a multiplier effect on your percentage returns (both gains and losses).
Simple Example:
Let's say Stock XYZ is trading at $100 per share.
You buy one call option to purchase XYZ at a $100 strike price. The premium for this option might be $3.00 (costing you $300, since one contract represents 100 shares).
Now, let's say the stock price moves up by just $2 to $102.
The Stock's Return: Your return on the stock would be 2% ($2 gain / $100 price).
The Option's Return: The value of your option might jump from $3.00 to $4.50. Your profit is $1.50 on a $3.00 investment. This is a 50% return.
A 2% move in the stock created a massive 50% move in the option. This leverage works just as powerfully in reverse, where a small negative move in the stock can wipe out a large percentage of your option's value.
Let’s study three fresh examples: NFLX selling off after E.R., SPY on a muted trading session, and TSLA rallying.
Following the examples we will study “the Greeks” (Delta, Gamma, Vega, and Theta), the key elements to consider when analyzing a technical chart when utilizing options, and today’s market considerations with more options examples:


