

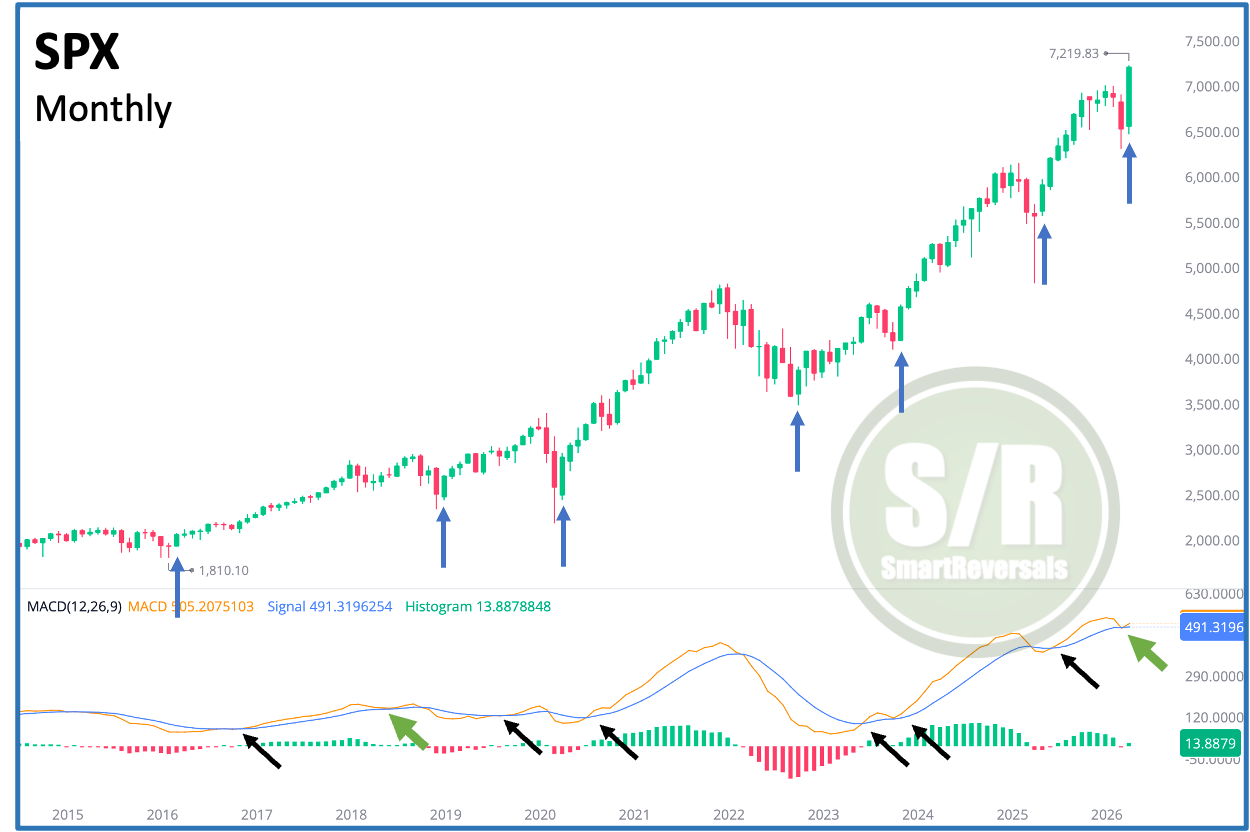
April finished on a bullish note, with price action demonstrating strong monthly conviction. The reversal from the recent correction suggests bullish continuation, as highlighted by the blue arrows on the chart. Notably, a bearish monthly MACD crossover was averted, a technical event mirroring the 2018 recovery following a similar correction. In that instance, the trend persisted upward, with a more significant reversal occurring only much later in the year.
As detailed in last night’s special study on the current structure: charts do not repeat, but technical patterns do. So the probabilities for the SPX reaching the bullish target I projected in November 2025 for this year have increased significantly.
During the March correction, I noted that if a major top were truly in, it would have marked the first bull market in decades with only a single 5% pullback, the rest is history; the bounce happened as also anticipated on the Weekly Compass of March 28th.
In case you missed it, this is the study posted last night assessing the current price action using clear indicators and benchmarks considering rare price events observed in April.

The month ended, and last night I posted the daily levels with a downloadable file, I received good feedback, so let’s use this post to update for all the paid community the monthly levels for May.
Unlock all the content by upgrading the subscription to the paid plan.
Also, I’m covering some questions that I have recently received about the daily levels.
COMBINED LEVELS: