
Sector Rotation: A Guide to the S&P 500 Momentum Status
Decoding Market Internals: A Roadmap to Sector Rotation in the 2026 Economy

The U.S. economy is a machine divided into eleven distinct sectors, each functioning as a vital element in the overall health of the S&P 500. For an educated investor, success isn’t just about finding the next “multibagger stock” every week; it’s about being disciplined with a well known set of principles, securities, and understanding Sector Rotation with the strategic movement of capital as it chases safety or growth across different stages of the economic cycle.
As we navigate 2026, the leadership has shifted away from tech giants of 2025 toward defensive and cyclical areas like Energy and Consumer Staples, both of which have recently reached all-time highs.
Today’s publication is the second installment of a special sector analysis that began last Wednesday. While the market digests NVDA’s earnings report, I will break down each sector’s drivers and their current technical conditions, list the largest stocks per sector by volume and fundamentals, and review how current market conditions compare with major tops observed in previous years before bear markets: 2000, 2007, 2018, 2020, 2022, and even 2025.
Today’s Agenda
Amid growing rising fears of a bear market, the ‘Great Rotation’ has become a central topic of discussion. Today, I am providing data-driven references, grounded in charts and facts rather than gut feeling, to help you:
Apply the Momentum Map to sector rotation.
Understand the drivers behind price action for all 11 sectors and the implications of which sector is leading.
Identify the core stocks within each sector.
Analyze technical charts to distinguish between sustainable momentum and exhaustion for each sector.
Compare current market conditions with those observed before previous bear markets.
Develop a strategic plan to navigate the current environment.
Evaluate high-probability setups for the week, including GLD, SMH, QQQ, and even the SPY is very close; all of which have already hit the targets established in the Weekly Compass named ‘Is Tech Better Than Defensives Today?’.
Last week’s installment can be found here: Click to access.
This is a publication to bookmark, or to print and keep at hand to read regularly, so you don’t get lost among the noise and can remain prepared with specific tools to navigate the market and manage expectations. Unlock today’s content, and all the Market Intelligence Collection:
Let’s begin:
Sectors - Momentum Map
Sector rotation occurs because different industries respond uniquely to interest rates, inflation, and consumer demand.
The Early Stage: Falling interest rates typically breathe life into the Information Technology and Real Estate sectors as borrowing costs drop.
The Late Stage: As an economy overheats and inflation stays “sticky” (as forecasted for much of 2026), investors rotate into Energy and Materials to hedge against rising prices.
Defensive Shifting: When growth concerns arise, “smart money” often flocks to Consumer Staples and Health Care, which are sectors that provide essential services regardless of economic health.
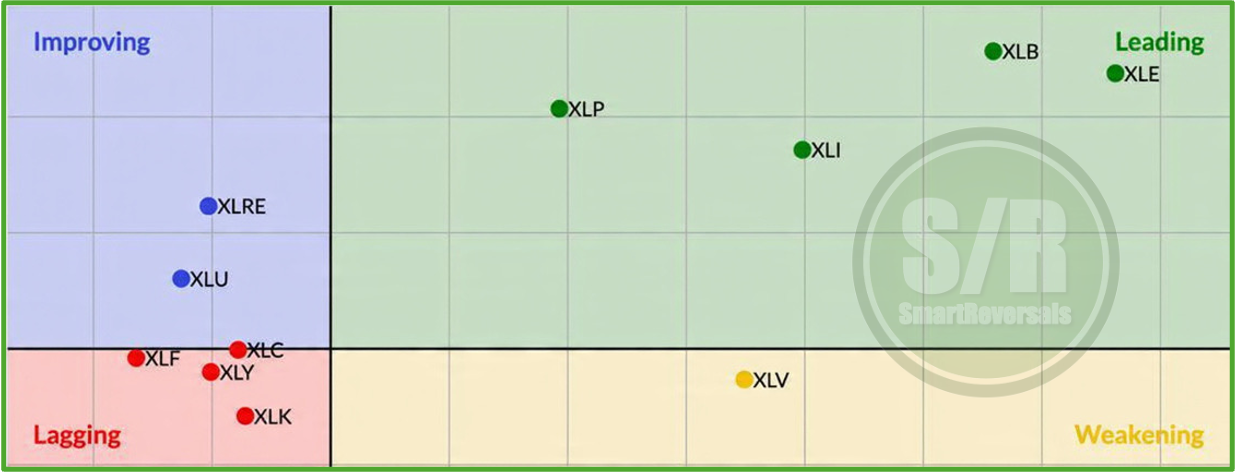
For new investors: the Momentum Map visualizes where each sector stands regarding its recent momentum and relative strength against the S&P 500. Each sector is in one of four quadrants. Currently, Consumer Staples (XLP), Industrials (XLI), Materials (XLB), and Energy (XLE) are Leading. Healthcare (XLV) is Weakening. Meanwhile, the Lagging quadrant houses Technology (XLK), Communications (XLC), Consumer Discretionary (XLY), and Financials (XLF). Finally, Real Estate (XLRE) and Utilities (XLU) are Improving.
Now let’s go to how to interpret the momentum map (be careful buying blindly a leading security), and then let’s see the details and charts of this first chapter
Understand the Drivers
Below is a breakdown of the 11 sectors, their core signals, their current 2026 technical posture, and the interpretation of the momentum map (be careful buying blindly a leading security using the map, you will see why).