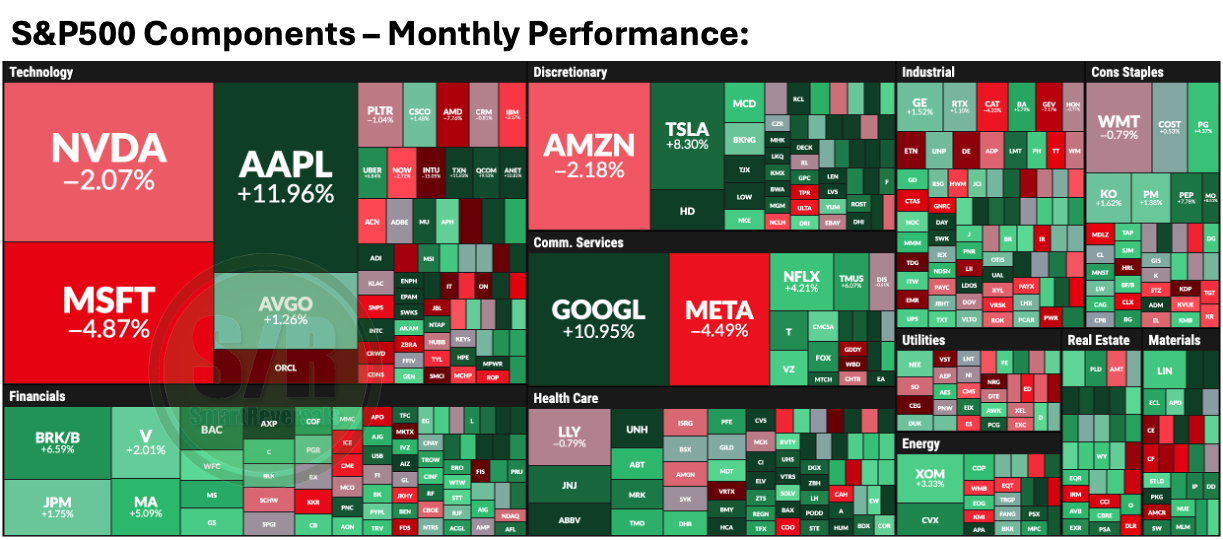
The multi-month rally is showing signs of shifting gears. Tech's losing some steam while other sectors pick up slack. Q4 will come down to whether corporate earnings can justify current prices, especially as the AI trade faces its first real test.
The market's not broken, but it's getting more selective about what deserves premium valuations.
Three things kept pushing the stock market higher:
Earnings delivered: 81% of S&P 500 companies beat Q2 expectations. That's the kind of fundamental strength that actually matters.
Fed's turning dovish: Powell's recent comments plus cooling inflation data have markets betting on a September rate cut. The PCE index—the Fed's favorite inflation gauge—came in right where expected, showing inflation isn't getting worse.
Small caps caught fire: The Russell 2000 surged 7% in August, its best month since November 2024. When rate cuts look likely, smaller companies with higher borrowing costs get a boost.
The AI Reality Check
Here's where things get interesting. The AI trade that's been driving everything finally hit some speed bumps. Nvidia, Dell, and Marvell Technology all got hammered after earnings that didn't live up to the hype. Nvidia had its first losing month since March.
Investors are getting pickier about AI stocks. The "everything AI goes up" phase is over. Now companies actually have to prove their AI investments are paying off.
What's Next for September
The setup for the final quarter looks decent but far from bulletproof. On the one hand, corporate earnings remain solid and the Federal Reserve is likely to cut interest rates. On the other hand, the main indices have been overbought for three weeks, printing indecisive candles on the daily and weekly charts. The technical indicators studied in this edition are flashing warning signs of an overheated market.
This caution is warranted, as market giant-front-runners like NVDA, MSFT, and META declined in August, following bearish signals highlighted here. The crypto space is no different; the overextended conditions and the top signal I highlighted two weeks ago for Bitcoin has proven again to be accurate.
Let’s consider these four elements for September:
Tech's high bar: AI and tech stocks set sky-high expectations for themselves. Anything less than spectacular gets punished now. The market wants to see real, widespread economic benefits from AI, not just a few chip companies getting rich.
Fed's data dependency: September rate cut looks likely, but after that? The Fed will move based on what the numbers say. Inflation surprises or labor market strength could change everything fast.
Market breadth matters: The Russell 2000's strength is healthy—it means gains aren't just coming from mega-cap tech anymore. If small caps and other sectors keep participating, this rally has legs into 2026.
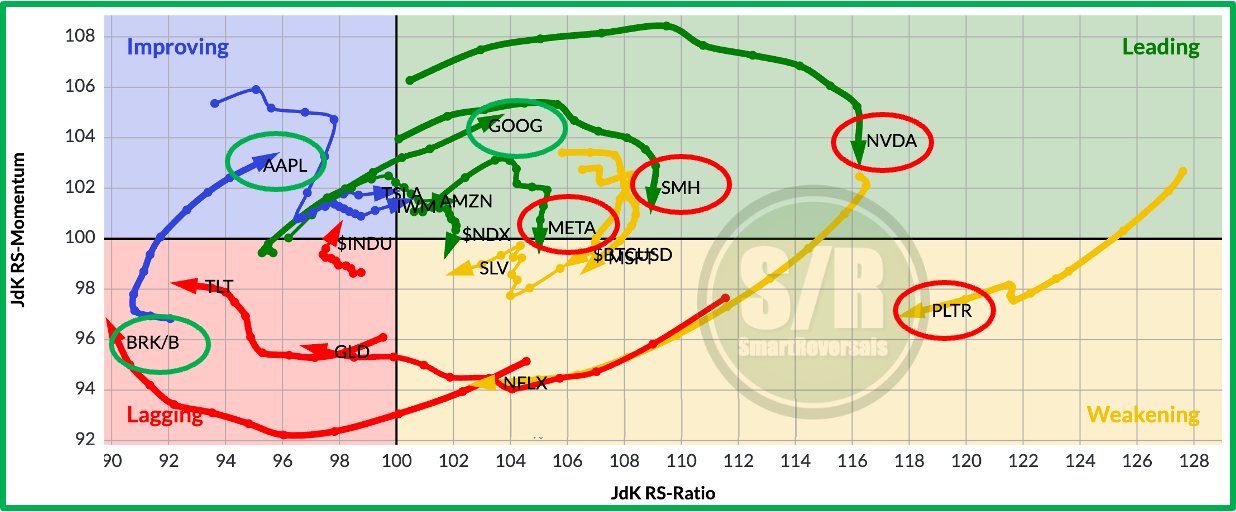
There are bullish opportunities out there: Similar to my bearish calls on MSFT, NVDA, PLTR, SMH, a couple of weeks ago, I have called the bullish reversal setups for AAPL, GOOG, BRK.B, GLD, SLV. Additionally, paid subscribers received my notes on the likelihood of TSLA being bought at specific support levels and they have the major resistance that has rejected price lately. All of these securities rallied over the last few weeks and closed the month in the green. The Relative Rotation Graph below visualizes the relative strength and momentum during the last 10 weeks for the securities analyzed in this publication. The purpose of analyzing constantly this group is to provide a market view with bullish and bearish setups so you can choose based on your preferences and risk profile.
Today, the focus shifts to managing risk for the new leaders, and finding supports for the securities and indices declining using the price levels that are updated weekly and included in the charts below.
This publication consistently analyzes price levels for the following securities to provide a broad market perspective and empower your trading decisions:
Indices & Futures: SPX, NDX, DJI, IWM, ES=F, NQ=F
ETFs: SPY, QQQ, SMH, TLT, GLD, SLV, DIA, SH, PSQ
Major Stocks: AAPL, MSFT, GOOG, AMZN, NVDA, META, TSLA, BRK.B, LLY, UNH, AVGO, COST, PFE, PLTR, NFLX
Crypto & Related: Bitcoin, ETH, IBIT, MSTR
Leveraged ETFs: TQQQ, SQQQ, UPRO, SPXU, URTY, SRTY, UDOW, SDOW
If you’re interest in some of these securities, this publication is for you.
Visit my market research and educational content, which includes special studies on market tops, breadth signals, the Bitcoin cycle, and market overextensions. The collection also covers options, technical indicators, fundamental analysis, trading psychology, and macroeconomics.
This content alone is worth the subscription. Premium subscribers appreciate the approach of learning with fresh, relevant charts, so I have gathered the entire collection in the following guide:
Upgrade your subscription to unlock all the content linked in this publication, plus everything available at smartreversals.com.
Let’s continue with the analyses for SPX, VIX, NDX, DJIA, IWM, SMH, SLV, GLD, TLT, BRK.B, NFLX, PLTR, GOOG, AAPL, TSLA, NVDA, META, MSFT, AMZN, BITCOIN, Breadth analyses for the indices; and three special charts, two of them measuring bearish targets for SPX and NDX respectively.
SPX
Bearish signals have been accumulating week by week; the warnings started with the semiconductor sector two weeks ago, were joined by the Nasdaq 100 last week, and this week, the S&P 500 is finally showing the same reversal structure. As mentioned yesterday in the S/R levels (click here for access), a rotation into other sectors like energy (XLE) and financials (XLF) was not enough to offset the decline in technology and hold up the broader index from a bearish weekly formation as follows:


