Weekly Close Confirms Bearish Setup
U.S. Stocks Wrap Up August with a Dip - Price Levels for U.S. Indices, ETFs, Major Stocks, and Crypto
U.S. markets closed lower Friday, ending a month of record gains with broad selling across most sectors. Light volume ahead of the Labor Day weekend didn't stop sellers from taking control, pushing the S&P 500 down 0.6%.
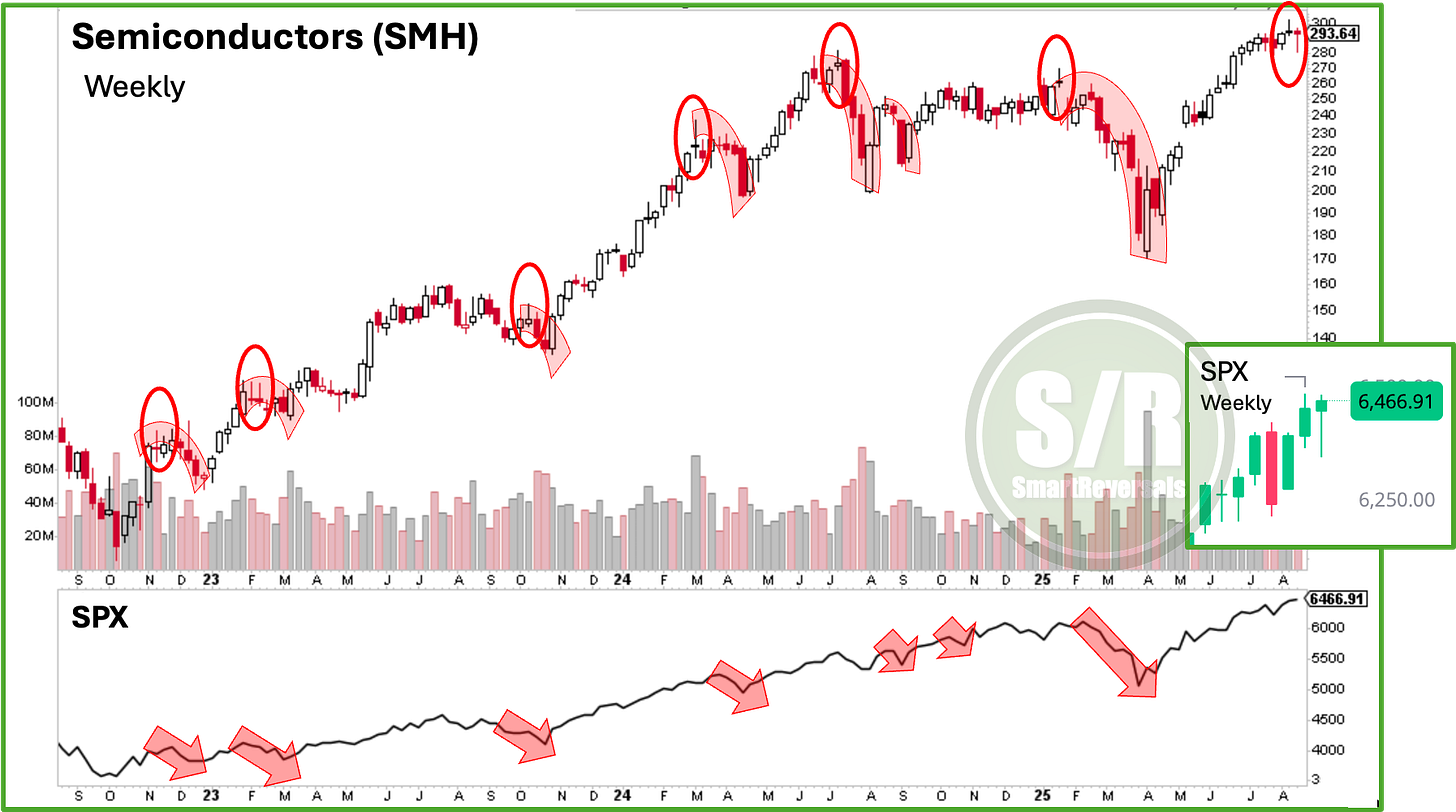
Tech led the decline, falling 1.6% and dragging the broader market lower. Semiconductors got hit especially hard—the Philadelphia Semiconductor Index dropped 3.2% as post-earnings selling hammered Marvell Technology (-18.60%) and Dell (-8.90%). Even NVIDIA couldn't escape, falling 3.29%.
Last Sunday in the premium chat, I shared this chart highlighting the warning signs from the semiconductor sector and the bearish price formation in the S&P 500. That weekly setup has now received its validation. Even though prices had to adjust on Friday—making the previous day's strength look like a potential bull trap—the bearish thesis is playing out.
The pain spread to economically sensitive areas. Industrials dropped 1.0%, weighed down by Caterpillar's 3.61% decline after the company warned that higher tariff costs would push its operating margin to the low end of guidance. Consumer Discretionary also fell 1.1%.
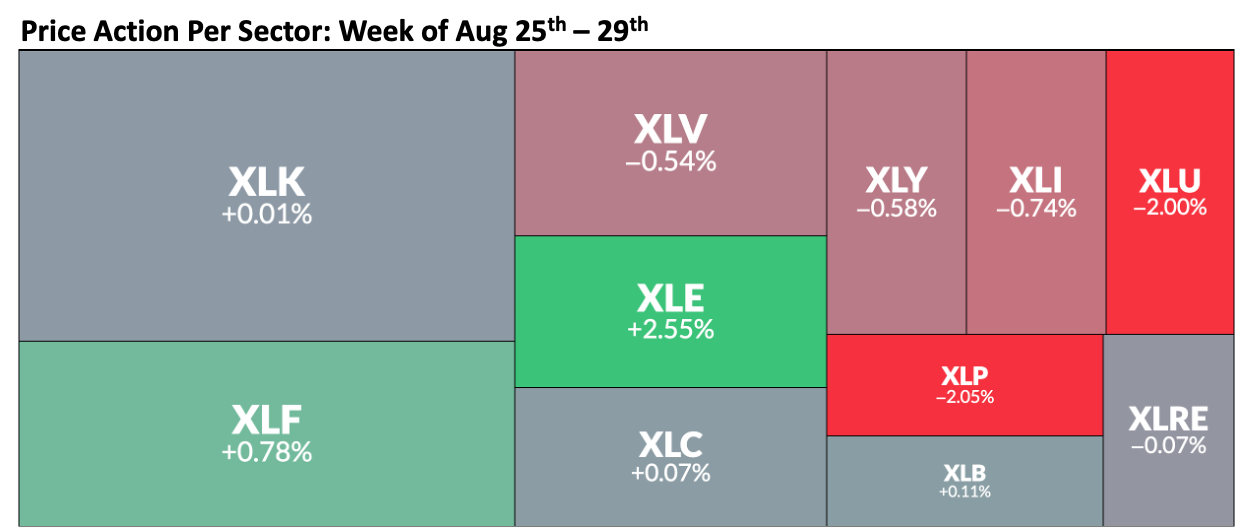
Energy and Financial sectors provided some shelter during the week. XLE led the gainers with a 2.55% rise, while XLF added 0.78%. But these gains weren't enough to offset an indecisive weekly formation that will be presented in the paid section.
Economic Data Remains Consistent with Expectations
July's Personal Consumption Expenditures data came in largely as expected. The core PCE—the Fed's preferred inflation gauge—rose 0.3% for the month and 2.9% year-over-year.
While that's still above the Fed's 2% target, markets are still pricing in an 86.9% chance of a September rate cut, according to CME's FedWatch Tool.
Fed Governor Waller backed that view, supporting a 25-basis-point cut. But other data looked shakier—the final August University of Michigan Consumer Sentiment reading dropped to 58.2, and the Chicago PMI hit a contractionary 41.5.
Year-to-Date Scoreboard:
Nasdaq 100: +11.4%
S&P 500: +9.8%
DJIA: +7.5%
Russell 2000: +6.0%
Find all my market research and educational content into a single, comprehensive guide. This guide covers everything from technical, macro and fundamental indicators to options, trading psychology, and macro analysis. It also features dedicated sections on advanced topics like Fibonacci, Elliott Wave theory, and market breadth. The section on my special market studies anticipated since April the rally we are now navigating. This content alone is worth the paid subscription.
Two essential publications that are a must read are:
The study of the most recent bullish breadth signal, and the assessment of what happens when it appears in a mature bull market:
The Bitcoin 4 years cycle, and the technical signals that warned with accuracy the current pullback.
This publication consistently analyzes price levels for the following securities to provide a broad market perspective and empower your trading decisions; at the bottom of this publication, in the paid section, you will find the key support and resistance levels for :
Indices & Futures: SPX, NDX, DJI, IWM, ES=F, NQ=F
ETFs: SPY, QQQ, SMH, TLT, GLD, SLV, DIA, SH, PSQ
Major Stocks: AAPL, MSFT, GOOG, AMZN, NVDA, META, TSLA, BRK.B, LLY, UNH, AVGO, COST, PFE, PLTR, NFLX
Crypto & Related: Bitcoin, ETH, IBIT, MSTR
Leveraged ETFs: TQQQ, SQQQ, UPRO, SPXU, URTY, SRTY, UDOW, SDOW
If you’re interest in some of these securities, this publication is for you.
Upgrade your subscription to unlock all the content linked in this publication, plus everything available at smartreversals.com.
Remember to comment with the securities you're interested in, and I will post the customized support and resistance levels in the chat this weekend.
Let’s continue with the support and resistance levels for the regular 44 securities mentioned; remember that red percentages in the second blue column indicate the securities that are currently closing with a bearish condition unless the price jumps in the proportion indicated. There is weakness across the board this time for the week ahead and some stocks for the month as well.
On the other hand, metals, BRK.B, UNH, LLY, some leveraged ETFs, and the inverse ones have bullish conditions as follows:
WEEKLY LEVELS


