
Shift Under the Surface
Key indicators suggest exhaustion in market front-runners. Analysis of the reversal flags and what to watch for next

Price action is showing exhaustion in some front-runners from the recent rally. Stocks like NVDA, MSFT, and PLTR remain in a consolidation phase, as anticipated last week, and their price structures are now raising cautionary flags for bulls, which will be analyzed below.
Some securities that were flagging bullish indicators last Saturday have since rallied, just as their price structures indicated. Both BRK.B and NFLX are now showing a clear shift/recovery in their trend.
Meanwhile, the formations for META and GOOG analyzed during the last weeks continue to play out as expected. Additionally, from the stocks analyzed in our support and resistance report, LLY and UNH broke above their central weekly levels, confirming their bullish reversal setups.
S&P Components - Price Changes for the Week:
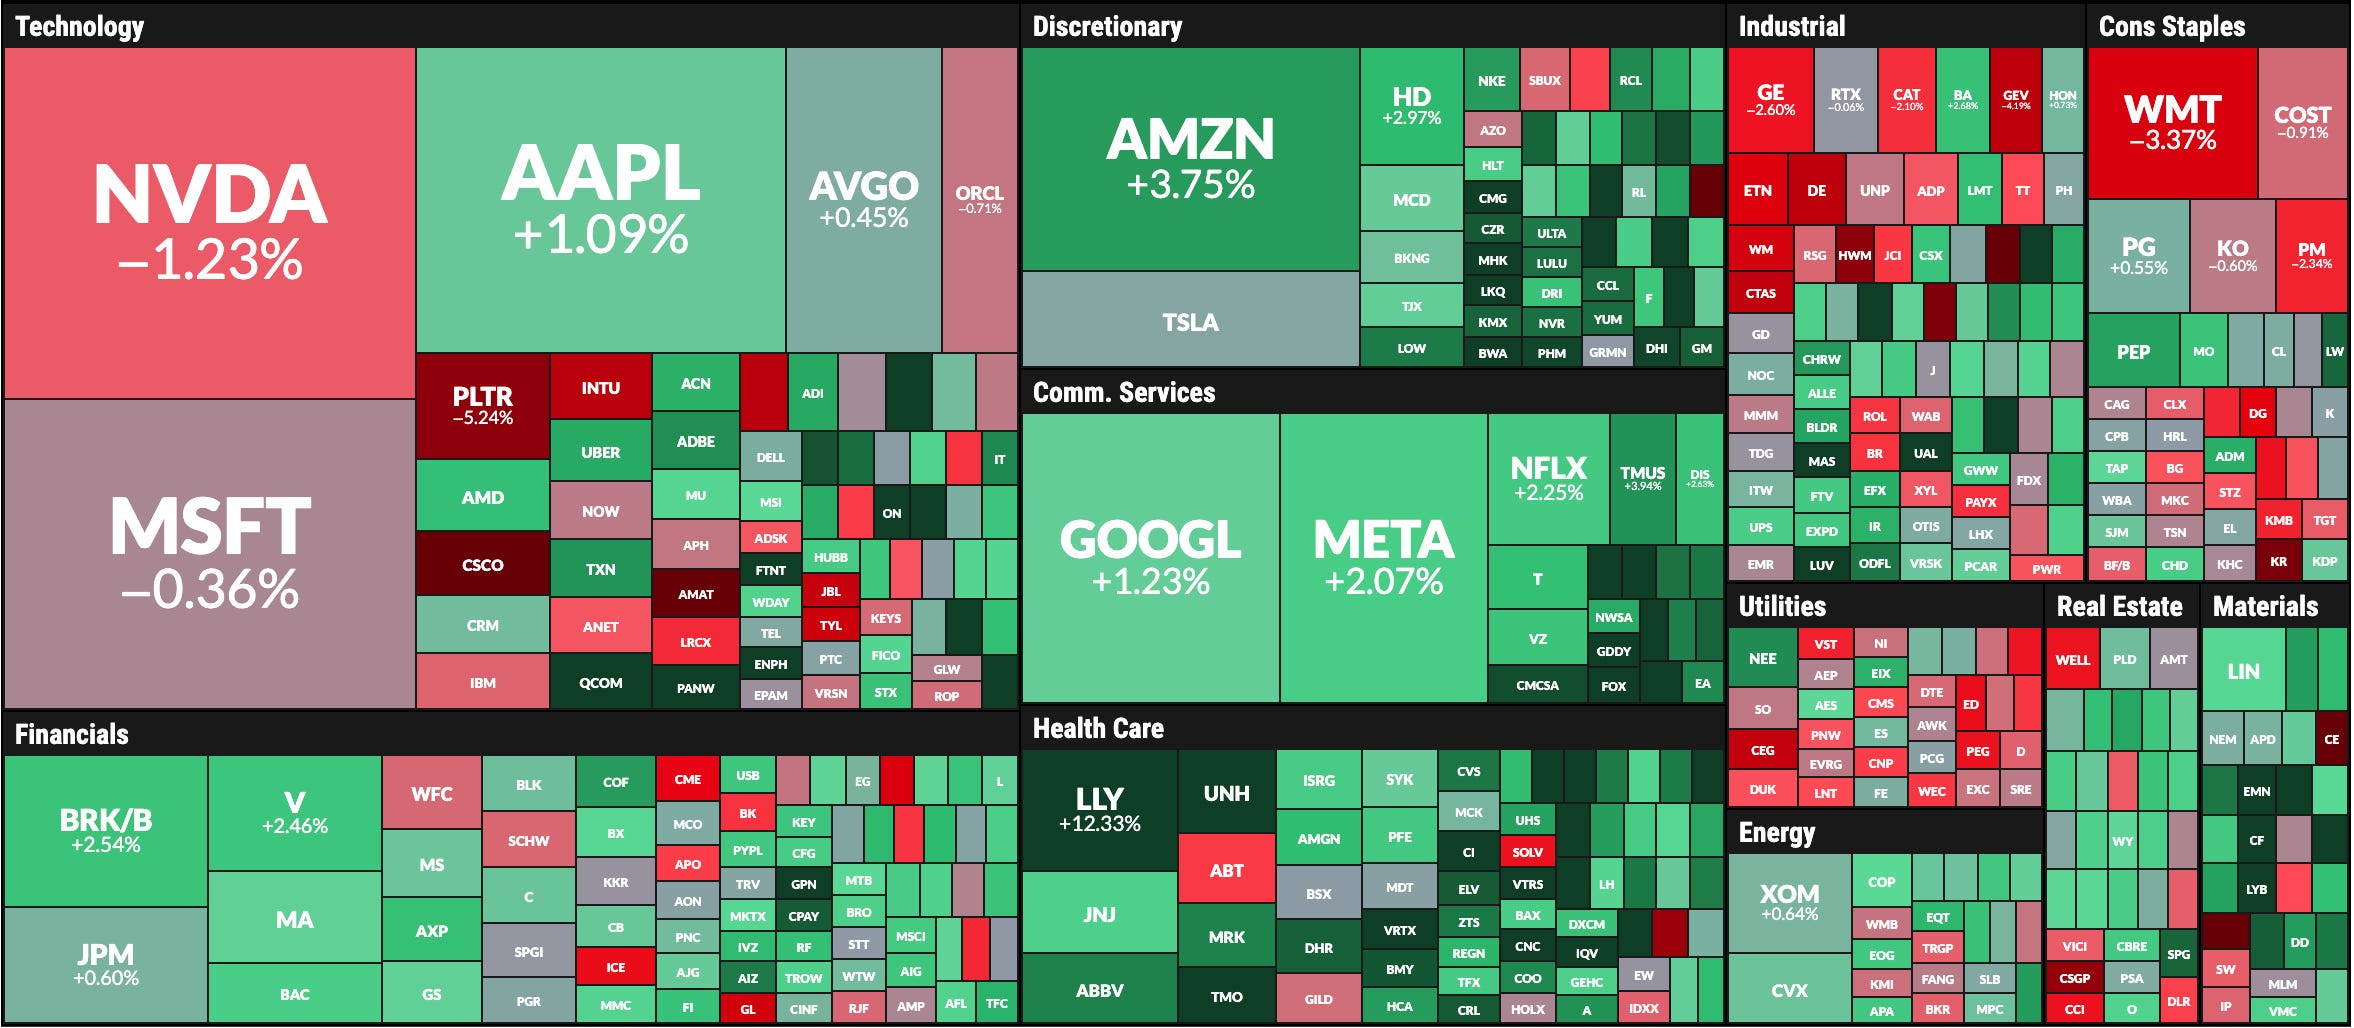
Key market leaders, including major tech stocks and semiconductor groups, are now raising reversal flags. Several technical indicators are displaying the same patterns observed at previous market tops. The rotation recently observed into healthcare and consumer staples is not expected to offset a shift in tech.
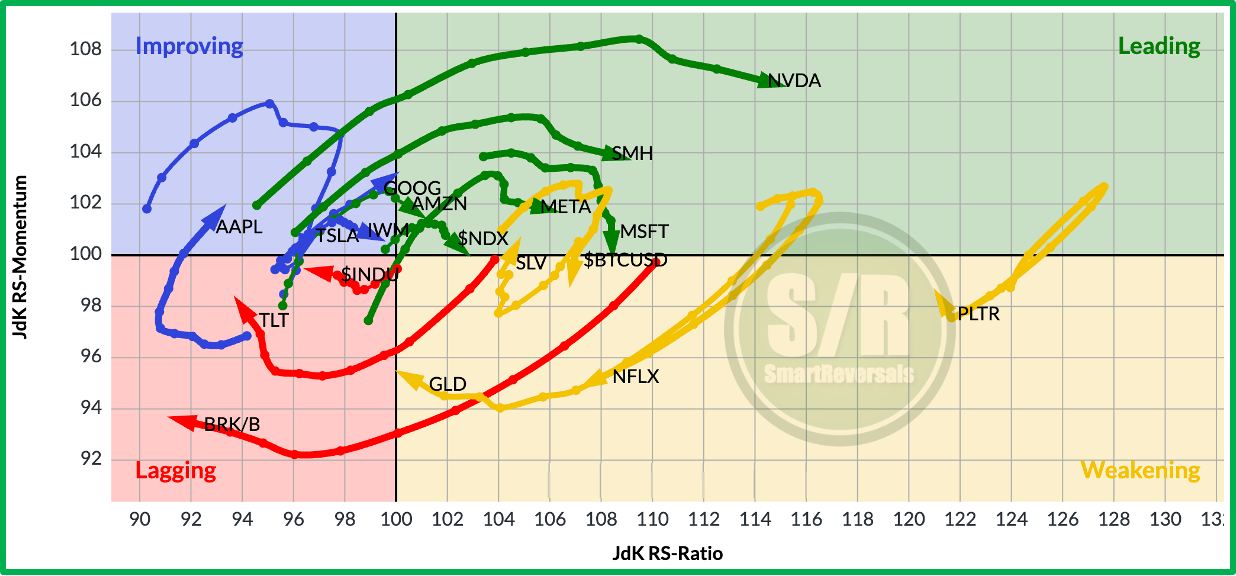
Today’s edition brings, as usual, the technical analysis for: SPX, VIX, NDX, DJIA, IWM, SMH, GLD, SLV, TLT, BRK.B, PLTR, NFLX, GOOG, AAPL, TSLA, META, NVDA, MSFT, AMZN, and BITCOIN. If you trade one or some of them, this publication is for you. The ones highlighted in bold are at critical inflection points, and they are a must watch.
The purpose of analyzing a consistent set of securities is to provide a well understood group for tracking relative strength and momentum. As the Relative Rotation Graph below shows, assets constantly move between leading, weakening, lagging, and improving phases compared to the S&P 500 benchmark. The chart presented here covers the last 10 weeks.
All technical details for each individual security, including specific price targets, are presented today. If you believe the rally—which I accurately anticipated in mid-April amidst widespread panic—is parabolic and will never take a breather, then today’s publication is a must-read.
I've consolidated all of my educational content and long-term market research into a single, comprehensive guide. This guide covers everything from technical, macro and fundamental indicators to options, trading psychology, and macro analysis. It also features dedicated sections on advanced topics like Fibonacci, Elliott Wave theory, and market breadth. The section on my special market studies—many of which were published in April and May 2025 and anticipated the rally we are now navigating—is constantly updated and is worth the subscription price alone. A new study focused on Bitcoin is coming this Wednesday.

Other recent publications:
Fundamental Deep Dive: Magnificent Seven and Palantir After Earnings:
Support and resistance levels for next week including today’s securities and also: SPY, QQQ, DIA, ES=F, NQ=F, AMD, AVGO, COST, UNH, LLY, IBIT, ETH, PFE, MSTR, SH, PSQ, and leveraged ETFs like TQQQ, UPRO, SPXS, SQQQ, URTY, SRTY, UDOW, SDOW:
Let's move on to today's analysis, which features an indicator that has been instrumental in timing market tops and bottoms and I analyze the destination for a well needed pullback, answering the question from some premium subscribers:
SPX