

Yesterday, I shared the NQ futures chart highlighting major technical cracks across the tape. The sharp bearish reaction to Amazon’s earnings reinforced a high probability of holding Thursday night’s breakdown formation at the very least. Today’s selloff comes as no surprise: while the flush could have extended into next week, the directional bias was south following last night’s close.
Every Thursday I check if there is a major signal ahead of the end of the week, here is yesterday’s note:

The broader short setup began taking shape on Tuesday after indecisive price action printed a series of lower highs that again, I posted in my daily note. While Wednesday traded relatively neutral, corporate earnings served as the downside catalyst after the bell, just as noted on Tuesday when highlighted that rate hike probabilities were below 10%.
Framing the Tape: Weekly Levels Review
Every Friday, I model quantitative support and resistance levels for the trading week ahead across our core watchlist of mega-caps and high-liquidity assets. Once again, these levels were key this week for the setups with higher probabilities:
MSFT: Declined directly into our 514.5 target for a -1.8% move, the loss of the CWL today triggered the setup since the week started in bullish mode.
XOM: Hit our high-probability 186.4 target for a +1.8% gain, with that level now flipping to active support.
SPX: Projected target at 7,567 was met, followed by a flush to 7,510 for a -1.5% move.
AVGO: Staged a textbook reversal toward 335.1, reaching our extended target of 348 smoothly on Wednesday for an +8.0% weekly gain.
WMT: Reached our projected 122 target (+2.3%), flipped the level into support, and pushed toward 125, another level modeled.
MSFT and SPX bounced today from or very close to the levels mentioned (514.9 and 7,510 respectively), a prove that institutional algorithms react to these levels.
Remember: more than 70% of the daily volume is driven by institutional algorithms in the NYSE. Since systematic algorithms dominate order flow, price action reacts around these specific technical levels.
Managing Risk with the Central Weekly Level (CWL)
My support and resistance framework relies on the Central Weekly Level (CWL) as the primary directional filter: holding above validates a bullish bias, while trading below confirms bearish control.
Beyond directional bias, the CWL provides an objective stop-loss anchor to manage risk in volatile conditions, and I have to say, this was not an easy week after the volatility spike on Wednesday after the bell. Consider two live examples from this week:
PLTR: Charts favored a bullish continuation, but the stock slid -6.4%. Because our CWL was set at 195.2, subscribers had an objective exit that capped the loss around -0.8% (I always suggest to set some space from the level).
LLY: Based on overbought conditions outlined last Saturday, I anticipated a pullback. However, a blowout earnings report sent the stock surging +11.3%. Our risk parameter at 1,277 (just 0.4% above the prior Friday’s close) kept downside exposure strictly contained.
In both instances, adhering to the CWL limited downside to -0.8%, while our winning setups captured gains ranging from +1.8% to over +8.0% (average 3.5%). This is how quantitative levels keep your risk-reward strictly asymmetric.
Technical analysis is key, just staying above a level demands technical analysis, price action/candles and momentum indicators at the very least. That’s why I post charts and levels combined.
Looking Ahead: Weekly & Monthly Levels for November
Because today marks the monthly close, I’m also updating our Central Monthly Levels (CML) for each ticker. Monthly levels cover wider ranges and provide essential macro perspective for both swing traders and long-term investors. Over the past two weeks, I shared charts illustrating the severe historical consequences of losing the CML on the SPX and QQQ.
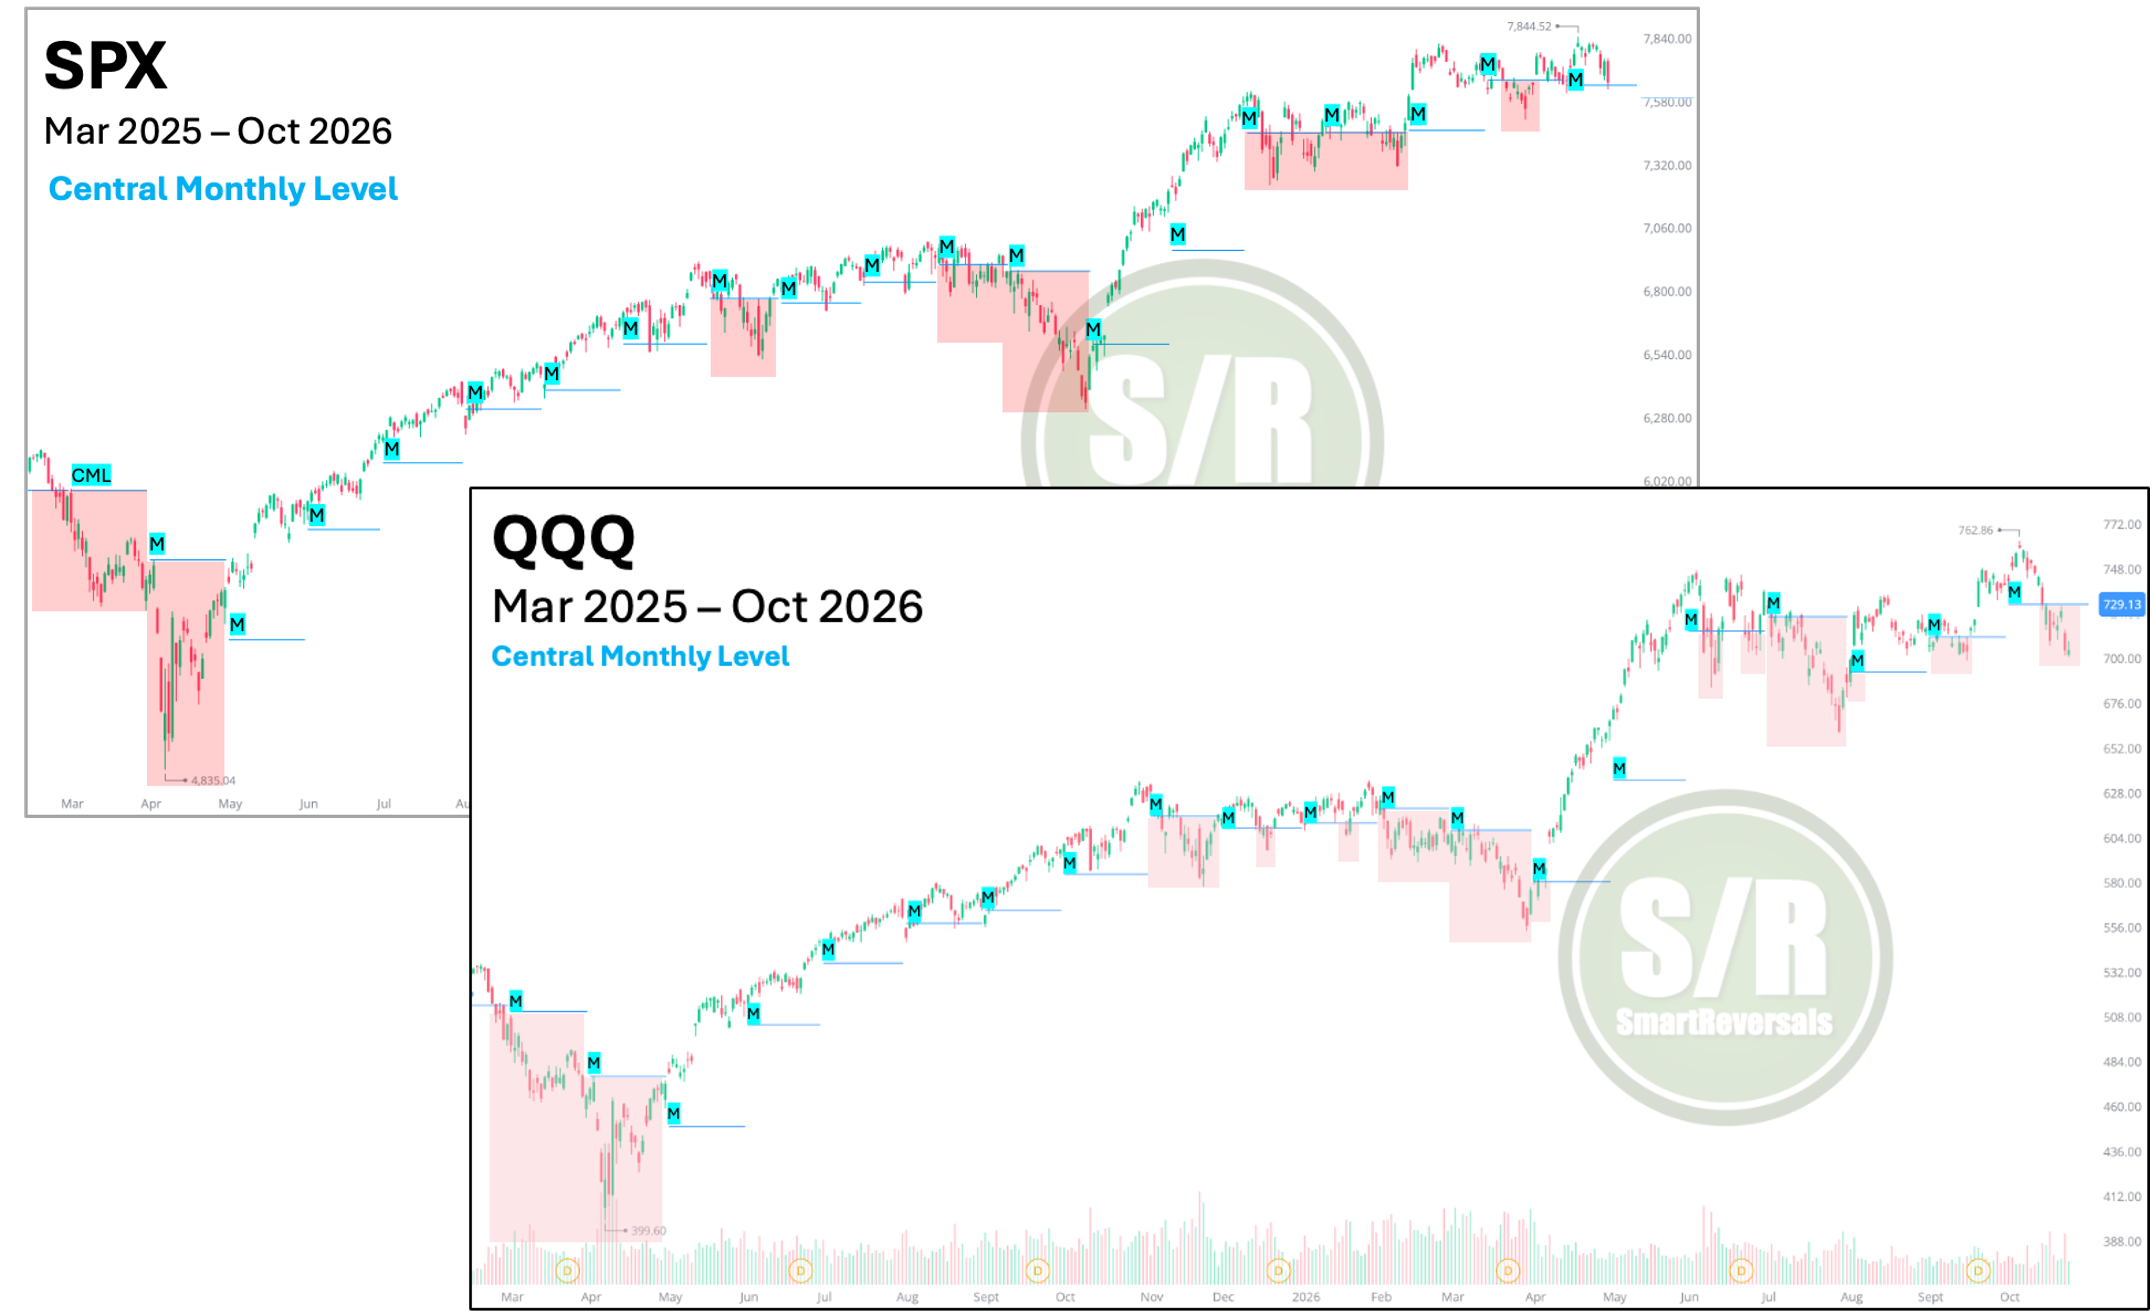
The levels are calculated for core mega-caps, high-beta momentum names, and liquid sector proxies across active options and leveraged ETF markets as follows:
Indices & Futures: SPX, NDX, DJI, IWM, ES=F, NQ=F
ETFs: SPY, QQQ, SMH, TLT, GLD, SLV, DIA, VXX
Major Stocks: AAPL, MSFT, GOOG, AMZN, NVDA, META, TSLA, SPCX, LLY, WMT, AVGO, COST, JPM, XOM, PLTR, NFLX, V, AMD
Crypto & Related: Bitcoin, Ethereum, ETHA, IBIT
Leveraged ETFs: TQQQ, SQQQ, UDOW, SDOW, UPRO, SPXS, URTY, SRTY
If you trade some of those tickers, this publication is for you.
Below, you will find the complete matrix of weekly and monthly levels. Each level includes its percentage distance from current price, allowing you to gauge immediate distance to target and measure risk versus reward ahead of Monday’s opening bell.
What You Get as a Paid Subscriber
When you upgrade to the paid plan, you unlock three core publications each week, along with exclusive member benefits:
→Friday: Support and Resistance Levels for the week ahead.
→Saturday: The Weekly Compass, featuring an in-depth technical immersion.
→Daily SPX & ES=F Levels: Receive daily levels assessing short-term momentum and potential reversal signals.
In addition to my weekly publishing schedule, your membership includes these perks:
→ Instant Ebook Access: Unlock my two foundational technical analysis ebooks directly from the Market Intelligence Library. (click here)
→Customized Level Modeling: Every Sunday, submit your watchlist stocks in the paid subscriber chat. Their specific institutional levels are modeled for the week ahead and published directly to the site.
All content is available at SmartReversals.com.
Don’t miss out this volatility Special:
Today’s Content:
Complete Weekly Levels for all Core Watchlist Tickers
New Monthly Levels and Macro Levels Matrix for November
Combined Weekly and Monthly Levels
Daily Plan for Monday (SPX and ES=F)
Fundamental Analysis for AMZN
WEEKLY LEVELS
Red across the board, but TSLA’s resilience is interesting , not to mention the non-tech stocks. Let me add here a note about the SPX and NDX: