

The market closed mixed: the NDX gained 0.42%, while the SPX fell 0.23% to 7,323.6. Yesterday, I posted 7,348 as the key differentiator between bullish and bearish momentum for the SPX, with 7,280 acting as support. Once the Central Daily Level (CDL) of 7,348 was lost, price action traded within that range. The bounce off the 200DMA suggested by futures vanished during the cash session, printing an indecisive daily candle while remaining in oversold territory.
For QQQ, today’s Central Daily Level was modeled at 655.7 to validate momentum, with upside resistance targeted at 662.8 based on weekly levels. Today’s intraday high hit 662.8 to the tick, proving how critical it is to map levels where institutional algorithms react ahead of the open, and to combine daily levels with longer-timeframe weekly and monthly levels. QQQ closed with a potential reversal candle that must hold above tomorrow’s central level. Below, I have updated the central levels along with surrounding reversal and consolidation zones for SPX, ES=F, QQQ, SMH, NVDA, AMD, MU, AVGO, and other semiconductor leaders.
Divergence among major chipmakers was the highlight of the session. NVDA yielded gains to close in the red and revisit its 52 week lows, while individual names across the artificial intelligence and hyperscaler groups closed green, including AVGO, AMD, and AMZN, all of them resilient during the week as well.
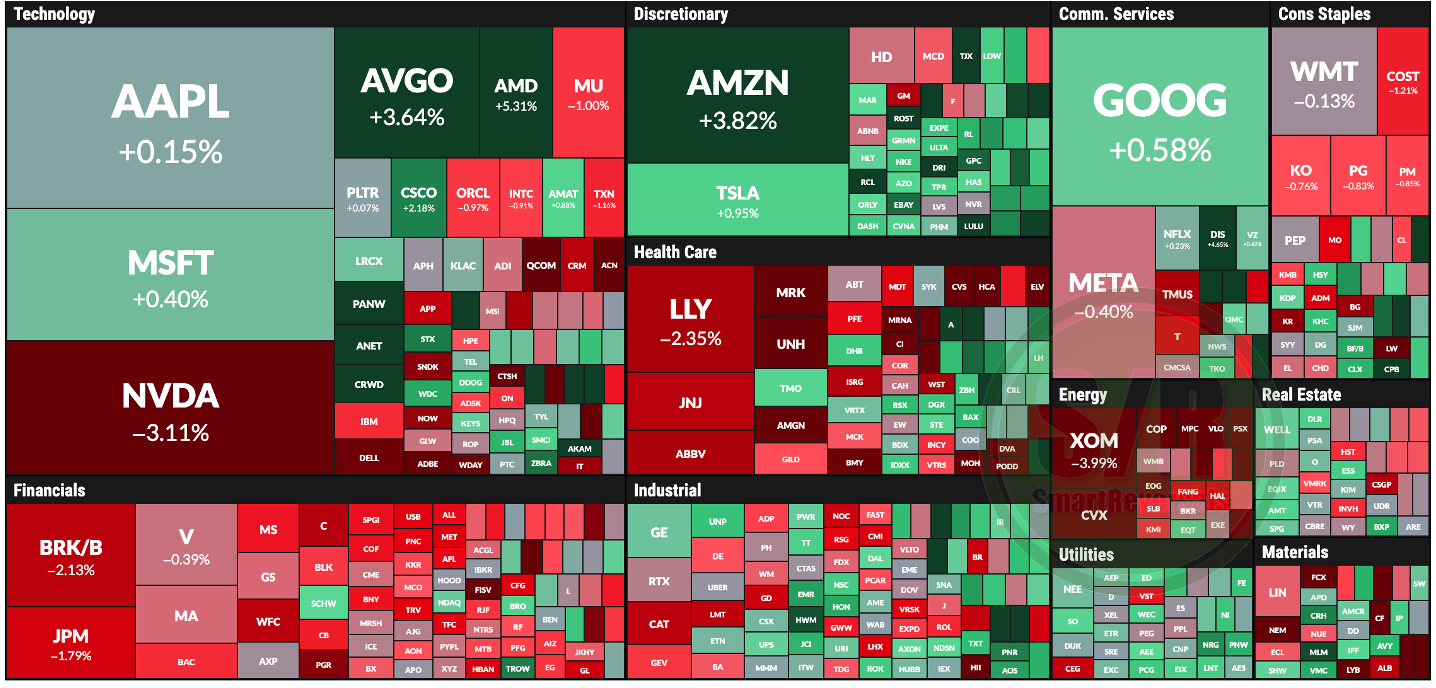
The key question is: why did Nvidia fall (~3%) while AVGO and AMD rallied? Institutions rotated capital into top semiconductor rivals. Specifically, AMD announced the completion of its $2.9 billion acquisition of AI chip developer Taalas, providing an additional boost to sentiment.
Yesterday, I shared initial highlights from NVDA’s earnings; today, the downloadable PDF one-pager is available in this publication. The company delivered a massive Q3 blowout, beating revenue estimates, issuing strong Q4 guidance, and announcing a new $150 billion stock buyback. However, sentiment remained weighed down by corporate governance following its CEO resignation and looming congressional hearings. Price action is significantly divorced from fundamentals right now, and understanding those fundamentals is essential for both long-term investors and active traders.
The complete fundamental breakdown for NVDA is here today, featuring price targets across 1-, 3-, and 12-month horizons alongside their respective catalysts. Paired with my ongoing technical coverage of NVDA in this publication, you have the complete roadmap to track those targets.
Today’s Agenda
What is the VIX Saying?
NVDA: Fundamental Deep Dive and Price Targets (Downloadable)
Watchlist Tracker
Daily and Weekly Levels Combined for SPX, ES=F, Semiconductor Giants
Daily plan for SPX, ES=F.
Upgrade to a paid subscription to access tomorrow’s daily levels, along with my comprehensive weekend publications featuring technical analyses, modeled price levels, and setups for this week.
A subscription also unlocks the full Fundamental Research Library, updated today with NVDA, including 1-, 3-, and 12-month price targets and catalysts to monitor. Get access here:

Finally, you can access my complete Market Intelligence and Educational Library right here, which includes two downloadable ebooks.

Let’s begin.