


In last Saturday's Weekly Compass, I anticipated a high probability of a bearish reversal in the SPX and a decline in the Dow Jones ETF (DIA), alongside bullish moves for SPCX, AVGO, and AMD, plus a spike in VXX. Today, those setups played out as expected: SPX (-0.58%), DIA (-1.1% reaching $528 🎯), SPCX (+3.7% to $154.1 🎯), AVGO (+2.9% touching 372.9 🎯), AMD (+5.9% crossing $503 as bullish target 🎯), and VXX (+1.5% 🎯).
The market is highly dynamic, being bearish on the SPX doesn’t mean that every single ticker in the stock market will fall, every ticker follows its own setup, providing both bullish and bearish opportunities, and that neutrality is what I analyze having a watchlist with indices, futures, megacaps, and high volume ETFs that cover different sectors. Today, we will review the Setups Blueprint that is published each Saturday and do a recap on how to best utilize it, including the price levels modeled in advance every Friday for the week ahead, and used to set targets, as the ones mentioned above.
It’s just Monday and five of the high probability setups are playing out reaching weekly targets, the Weekly Compass is here:

When you subscribe to the paid plan, you unlock all the content at SmartReversals.com, including the setups blueprint and the support and resistance levels for the week in play, all the market intelligence and educational library that includes special technical studies and fundamental analyses. The Market Intelligence has my two ebooks on Technical Analysis available for paid subscribers.

Today’s Agenda:
How to use the Setups Blueprint
Tracking our Watchlist
Daily SPX and ES=F Levels for tomorrow
Let’s begin.
Setups Blueprint: All the regular watchlist in one dashboard with price targets and invalidation levels
The Weekly Compass provide the technical context for the SPX and the market in general by analyzing breadth, volatility, momentum indicators and reversal risks. Within that core publication, there is a section named the Setups Blueprint, where you can find the condition for each ticker (bullish or bearish), price targets, invalidation levels, and the risk/reward ratio.
Here is the Setups Blueprint for this week, where the decline in the SPX🎯 and DIA🎯 was anticipated, along with the bullish moves for AVGO🎯, SPCX🎯, AMD🎯, and VXX🎯:
I post a set of charts in the Weekly Compass, they cover indices and a set of megacaps with the purpose to provide guidance on the most popular tickers in the market; the charts rotate every week depending on reversal chances, momentum, or as a learning reference depending on the context.
Having a watchlist helps you navigate sector rotations. Over the past year, we have navigated double-digit rallies in LLY, GOOG, PLTR, etc; alongside reversals in AAPL, TSLA, NFLX, MSFT, and SPCX on both the bullish and bearish sides. I learned to rotate because each stock has its own cycle; when one becomes exhausted, others are warming up for a rally, providing opportunities for both bulls and bears depending on each person’s investment profile. With that said, the blueprint permanently includes all tickers on the watchlist, whether you prefer NVDA, AMD, or TSLA, or if you are simply focused on the SPX or QQQ.
When I highlight with a grey mark a ticker, it means that it is a setup with high probabilities to move in a specific direction (bullish or bearish), and the targets for the week, in the examples AMD was marked as bullish targeting 490.8 and 504 for the week.
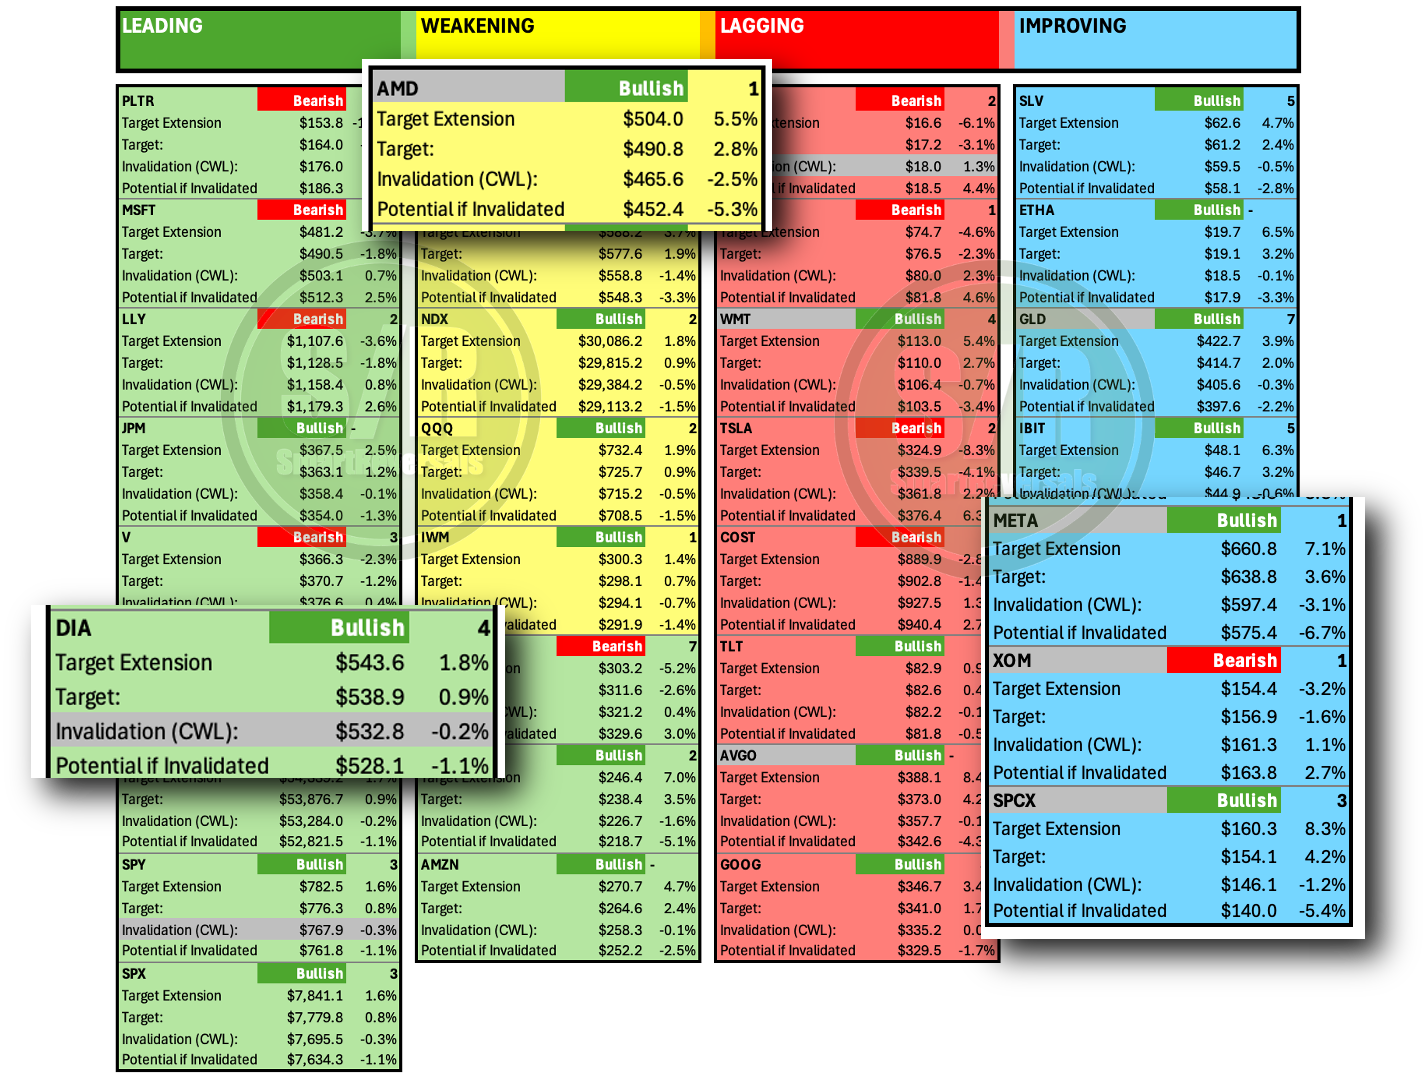
I also mark setups that are likely to reverse, as it was the case for the SPX and the DIA, both closed last Friday above the Central Weekly Level for this week, but their technical charts suggested a bearish reversal, which is confirmed when the Central Weekly Level (CWL) is breached, invalidating the bullish setup and opening the door for the potential target if invalidated, in the case of DIA, $528.1 was the target set, and where the price landed today.
The invalidation level is a reference to protect capital, a line that if breached the bullish or bearish condition gets invalidation and the odds for a reversal increase. People who use stop loss as a protection mechanism can use that price to set the trigger below it for longs and above it for shorts.
GLD breached today the central weekly level (CWL), invalidating the bullish thesis, the question is: What to do?… Well, once 405.6 was breached, the price my find a stop loss depending on where it was placed; in those cases the ticker can be disregarded for the week, or if the setup is strong it could remain on watch for the coming days, as it happened last week with META following the breach of 572.5 (CWL) on Monday, but the price recovered on Tuesday reviving the bullish thesis and reaching the bullish targets.
Some people set the stop loss below the first support level, not using the CWL as the main reference, it is valid, everything depends on each person’s risk tolerance and risk reward.
Risk Reward: If the first target for this week with META is 638.8 (+3.6% versus Friday’s close), and the invalidation level or CWL is at 597.4 (-3.1%), there risk is the same than the reward. However, for SPCX the potential gain is +4.2% versus the distance to invalidation of -1.2%. 3:1 ratio. If the support is used for invalidation, just make sure than the potential reward is bigger.
We will navigate this Blueprint during the week, getting use to a structured approach could demand observation, then some paper-trade, and then a progressive increase in exposure.
Tracking our Watchlist
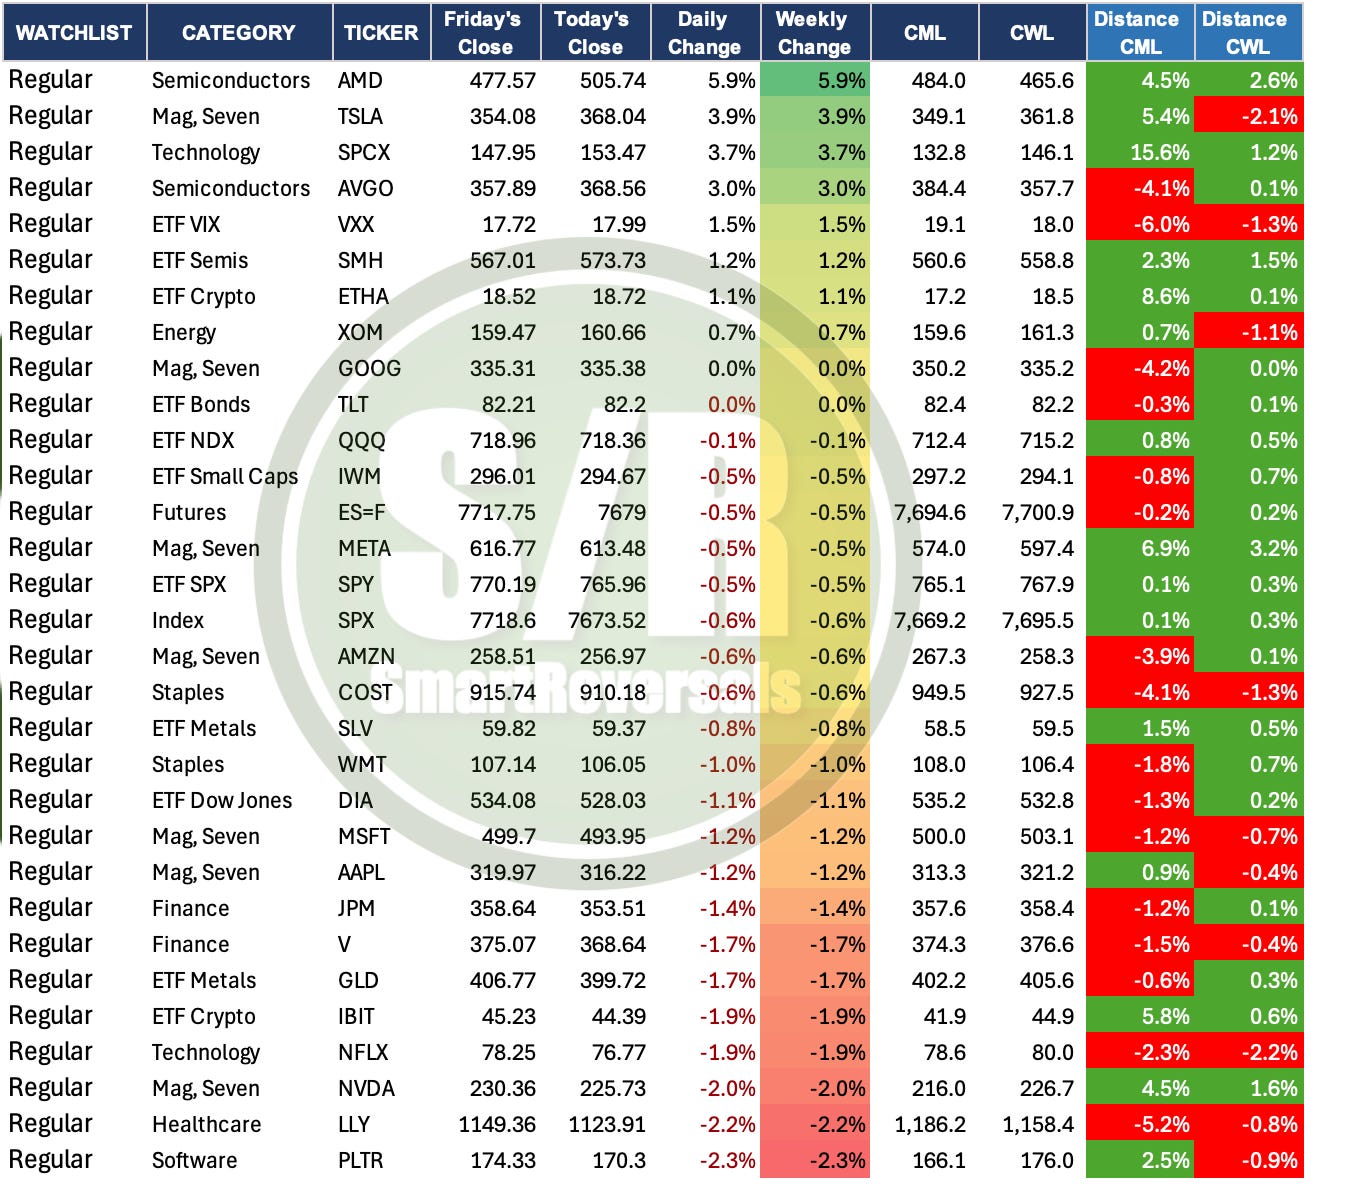
To navigate the market using our watchlist, this report will now be part of our daily updates. This allows you to see the daily movers in a single dashboard, with the list ranked by cumulative weekly moves. We will elaborate on how to make the most of this tool this week, for now see the distance from the CML and CWL for each ticker.
Important note: Gaining +5.9% in one day is great, but beware of the gap below at 478.8, in this case the ideal for bullish continuation for AMD is to stay above 490.7 and 503.9 as ideal case.
Daily Plan for SPX and ES=F
The SPX (-0.6%) closed at 7,673.5 with bearish conviction, suggesting more bearish price action is coming. The price closed below tomorrow’s central daily level (CDL) at 7,686.1 (+0.2%) with conviction. Next bearish targets are at 7,654.4 (-0.2%) and 7,635.3 (-0.5%). Recovery of 7,686.1 opens 7,705.2 (+0.4%) and 7,736.9 (+0.8%). The SPX lost its CWL at 7,695.5 today, coming from 0.3% above it yesterday.
The ES=F (-0.5%) closed at 7,679.0 with indecisive price action below its CDL at 7,693.3 (-0.2%). Price continues bearish below the CDL with targets at 7,658.0 (-0.3%) and 7,637.0 (-0.5%). Recovery of 7,693.3 opens 7,714.3 (+0.5%) and 7,749.5 (+0.9%). ES=F also lost its CWL at 7,700.9 and crossed below its CML at 7,694.6 today, both bearish structural events. The CML loss, even with indecisive price action, is a meaningful longer-term signal to monitor.