
The Gap Will Be Filled - What Will You Do?
Price Levels for 44 securities including U.S. Indices, Megacaps, Futures, Metals, and Crypto


Last Wednesday we studied a top-down approach that combines technical indicators, fundamental analysis, and support and resistance levels, you can find the guide here:
The publication and the eBook inside available to download are open for everyone. I’m just waiting for more likes on this post to release the next section of the eBook, which covers Moving Averages.
It’s a simple deal: your likes help my publication get more visibility on Substack, and in return, you get the next chapter of the eBook. You don’t have to attend a “masterclass” or watch a two-hour video to get it. Just a quick boost to my posts.
On Wednesday, I anticipated that the VIX was pointing south. Despite a bearish price action structure in the indices, the VIX was in “crash mode,” which suggested the stock market could move up. That’s exactly what happened.
But in addition to the VIX analysis, we also reviewed our central weekly levels approach. This method indicates that as long as a stock stays above its central weekly level, the bias is bullish, and any bearish thesis remains unconfirmed. The price action for the SPX did fill the gap, but it remained above its central level. Therefore, the correct approach was to continue considering long positions.
The central levels posted for premium subscribers last Friday for the week that just ended were: SPX: $6,647.7, NDX: $24,690.8, DJI: $46,112.0, ES=F: $6,666.3, NQ=F: $24,823.9, SPY: $662.6, QQQ: $600.8, IWM: $245.5, DIA: $461.1, SMH: $340.1, NVDA: $183.5, MSFT: $512.3, AMZN: $214.9, GOOG: $250.7, AAPL: $250.1, TSLA: $432.9, PLTR: $177.9, NFLX: $1,202.2, and many more securities including leveraged ETFs, GLD, SLV, ETH, and others. Providing a validation criteria in case of a decline or bearish move.
Let’s study the Support and Resistance Levels for next week (central level with three price layers as support and three in resistance position), for the following securities:
Indices & Futures: SPX, NDX, DJI, IWM, ES=F, NQ=F
ETFs: SPY, QQQ, SMH, TLT, GLD, SLV, DIA, SH, PSQ
Major Stocks: AAPL, MSFT, GOOG, AMZN, NVDA, META, TSLA, BRK.B, LLY, WMT, AVGO, COST, JPM, PLTR, NFLX
Crypto & Related: Bitcoin, ETH, IBIT, MSTR
Leveraged ETFs: TQQQ, SQQQ, UDOW, SDOW, UPRO, SPXS, URTY, SRTY
»»» Click Here to Upgrade your Subscription - Unlock the Levels for Next Week
The support and resistance levels provide serious probabilities of reversals, for example TSLA was rejected from $447.9 this week, the bullish target posted last weekend based on the levels, NVDA bounced with precision from $176.9, PLTR bounced from $171 (a level modeled one week ago), and found rejection at $185, one of the resistances anticipated.
When you have those levels, you have an edge to consider potential reversals once the central level is breached, if you trade one or more of the securities mentioned above, this publication is for you.
The current situation of the securities studied versus the S&P 500 is this:
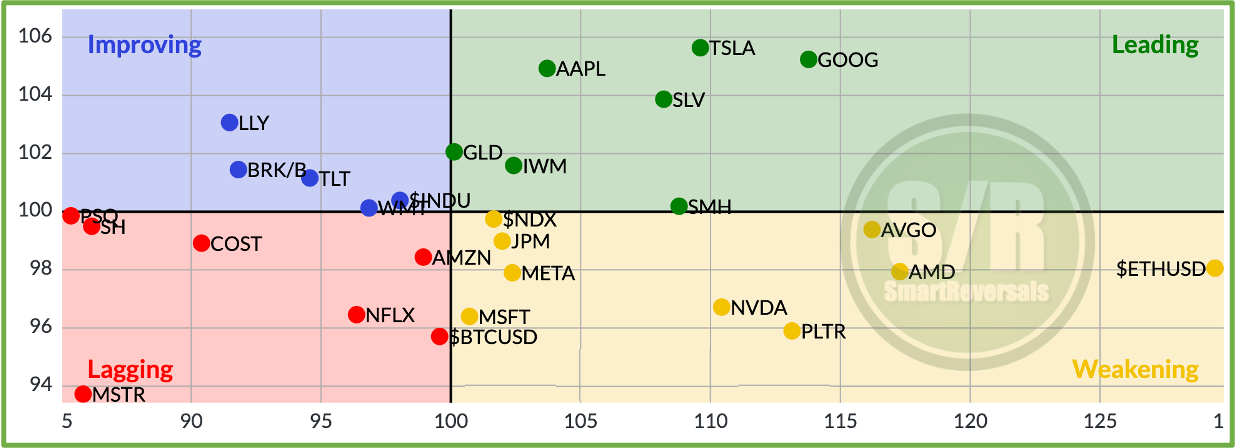
The Top-Down Trading Method guides you about how to use this tool.
Get the premium subscription and unlock:
Weekly Stock Market Analysis
Volatility Update
Support and Resistance Levels
All the Market Intelligence studies, as the two mentioned below
All the Fundamental library, soon with all the updated Earnings Reports
Weekly Compass
Spoiler alert: Today’s gap will be filled, I anticipated a fill of the gap from last week, and it this stage of the market gaps are filled, the question is: What Will You Do?
Two publications present comprehensive studies about the state of the bull market:
Let’s begin:
WEEKLY STOCK MARKET ANALYSIS
Record Highs as Cool Inflation Data Fuels Risk-On Rally
Today’s session delivered a display of bullish conviction, as investors wholeheartedly embraced “risk-on” sentiment that propelled all three major indices to fresh record highs. The Dow Jones Industrial Average surged 1.0%, gaining over 460 points to close above the historic $47,000 mark for the first time. The S&P 500 advanced 0.8% to finish above $6,791, while the Nasdaq Composite led the charge with a 1.2% gain.
Cool CPI Cements Rate Cut Expectations
The primary catalyst for this rally emerged from this morning’s September Consumer Price Index report, which came in cooler than anticipated. This data provided precisely the confirmation markets sought, cementing expectations for two additional Federal Reserve rate cuts before year-end. The softer inflation reading removed a key uncertainty overhang, unleashing pent-up buying pressure across sectors.
Technology Leadership Drives Broad-Based Advance
The session’s advance was notably broad-based, with strong leadership from the market’s most influential names. Information Technology emerged as the day’s top-performing sector, gaining 1.6%, driven by several converging catalysts:
Semiconductor strength: Intel’s surprise earnings beat boosted chipmaker sentiment broadly
Quantum computing breakthrough: Reports of advances in quantum technology sent IBM soaring 7.88% and AMD climbing 7.63%.
Cloud computing momentum: Alphabet gained 2.67% after securing a significant cloud deal with AI firm Anthropic (remember this was one of the stocks I highlighted last weekend as bullish).
Even in the flat Consumer Discretionary sector, pockets of exceptional strength emerged. Ford jumped 12% after surpassing earnings expectations, demonstrating that company-specific execution continues rewarding investors despite macro headwinds in the automotive sector.
Technical and Fundamental Backdrop
As markets head into the weekend, momentum appears firmly established. Today’s optimism reflects not a single data point but a confluence of supportive factors: