
Validating Setups with the Central Weekly Level (CWL)
How to use this objective tool to confirm market direction and manage risk effectively - Levels for Dec 29th to Jan 2nd

Last week, the Weekly Compass anticipated a bullish context for the overall stock market that played out perfectly. Following the setup highlighted for premium subscribers, the SPX jumped 1,4%. As shown in the chart below, our analysis identified a specific pattern (highlighted in yellow) that suggested bullish continuation for the week that just ended.
My approach combines technical indicators with modeled support and resistance levels. A cornerstone of this strategy is the Central Weekly Level (CWL). When the price stays above the CWL, it validates a bullish setup; when it remains below, it confirms a bearish outlook. For this week, the CWL sat at $6,805. Since price action remained consistently above this threshold, traders using the CWL as a reference for stop-losses or decision-making were able to stay in the trade and secure +1.4% gains for the S&P500 during the week.
See a segment of the analysis shared with premium subscribers. To view the complete publication with all the indicators for SPX and other 20 securities, click here: Positioning for Santa Season
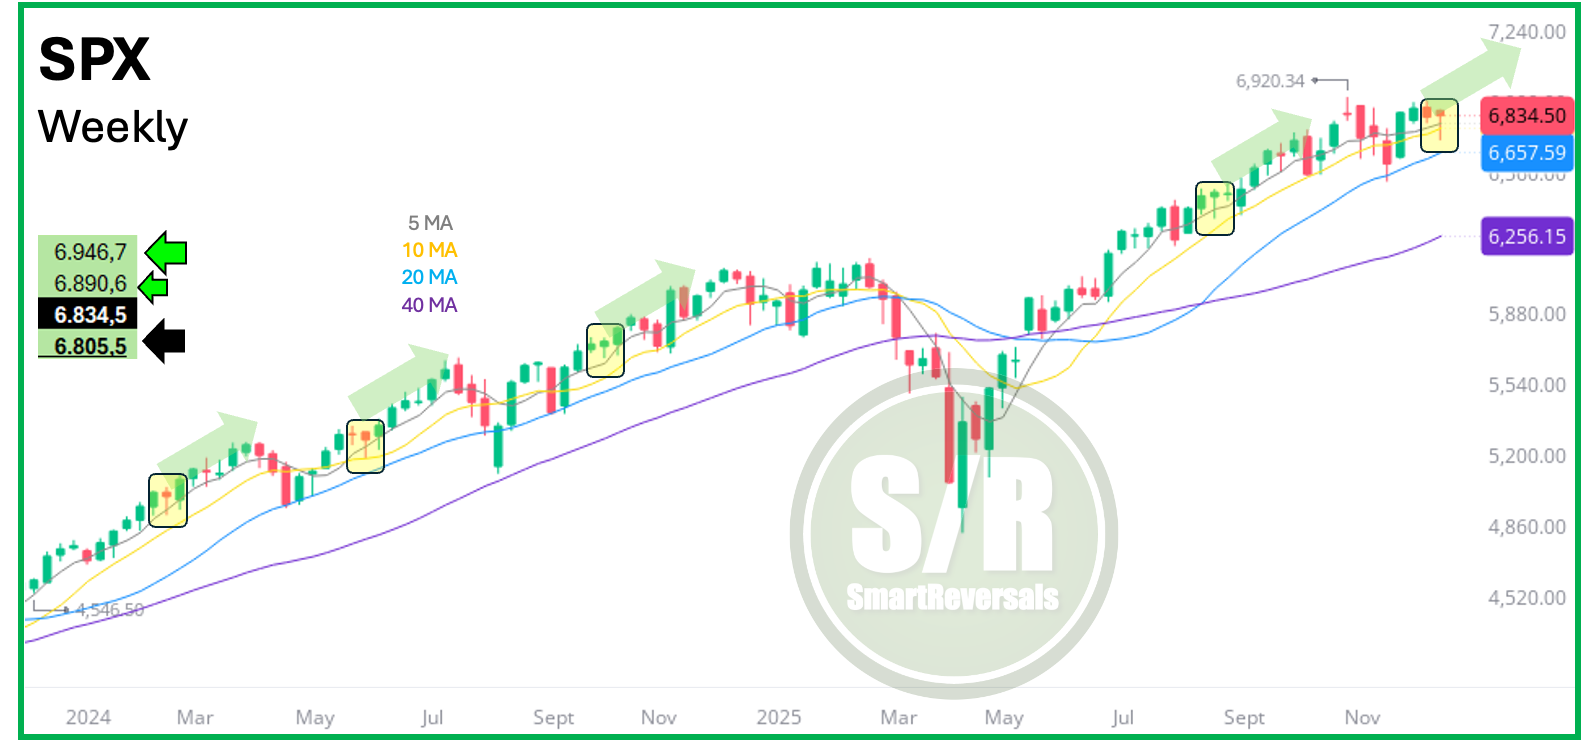
$6,890 was anticipated on the chart as immediate bullish target, but the price jumped to the next key level also anticipated in our analysis. It hit $6,956 with exact precision today at the open and consolidated during the rest of the day.
High-Probability Setups: The Formula for Success
My top picks from last week performed well, the front runners were: NVDA (+6%), SMH (+3.3%), and NDX/QQQ (+1.27%). Each of these setups, detailed with charts for premium subscribers, maintained its bullish structure by holding above its specific Central Weekly Level (CWL), the individual analyses for them were conducted as for SPX as the summarized example presented above.
The Power of the CWL and S/R Zones
Why do we model these levels? To frame the week’s price action with precision. These zones act as a roadmap, helping subscribers identify profit targets and spot reversals before they happen. This method proved vital for LLY (+1.7%) and PLTR (+2.8%), both of which reversed at the bullish target zones provided in the Weekly Compass.
My analysis covers several securities and it was good to see COST (2.1%) forming a bullish reversal formation as considered in the Weekly Compass, same case for AVGO (+3.7%).
High-Probability Setups: The Formula for Success
My top picks from last week performed well, the front runners were: NVDA (+5.3%), SMH (+3.0%), and NDX/QQQ (+1.2%). Each of these setups, detailed with charts for premium subscribers, maintained its bullish structure by holding above its specific Central Weekly Level (CWL), the individual analysis was conducted as for SPX as the summarized example presented above.
The Power of the CWL and S/R Zones
Why do we model these levels? To frame the week’s price action with precision. These zones act as a roadmap, helping subscribers identify profit targets and spot reversals before they happen. This method proved vital for LLY (+1.7%) and PLTR (+2.8%), both of which reversed at the bullish target zones provided in the Weekly Compass.
My analysis covers several securities and it was good to see COST (+1.9%) forming a bullish reversal formation as anticipated in the Weekly Compass, same case for AVGO (+3.7%).
CWL as Insurance
A professional, clear analysis of price action is the superior method for navigating the market. By cutting through the noise of social media and mainstream news to focus purely on price, we maximize our probabilities. This week, only two of our nine high-probability setups (TSLA and AAPL) were invalidated on Monday. However, today’s close brought them back to weakness.
This highlights the core purpose of the CWL: it provides an objective tool for decision-making. It protects you from getting drawn into painful selloffs on long positions or getting squeezed on short positions when the price moves against you.
Securities Permanently Analyzed in Premium Content
Having a broad market view you can monitor the market like professionals, and you can rotate positions or manage better your entries and exits if you’re focused on specific securities - This publication is effective for both cases:
Indices & Futures: SPX, NDX, DJI, IWM, ES=F, NQ=F
ETFs: SPY, QQQ, SMH, TLT, GLD, SLV, DIA, SH, PSQ
Major Stocks: AAPL, MSFT, GOOG, AMZN, NVDA, META, TSLA, BRK.B, LLY, WMT, AVGO, COST, JPM, PLTR, NFLX
Crypto & Related: Bitcoin, ETH, IBIT, MSTR
Leveraged ETFs: TQQQ, SQQQ, UDOW, SDOW, UPRO, SPXS, URTY, SRTY
Now, let’s look at the levels. A quick reminder: Premium subscribers have the privilege of suggesting specific tickers. Last week, we provided over 60 key levels for assets including ORCL, TSM, BABA, IREN, AMAT, and many others, empowering members to catch reversals and ride momentum.
WEEKLY LEVELS