
War of Attrition: Why This Bearish Resolution is Exhausting Both Sides
Navigating the "Inverse U-Turn" regime where rallies fade and spikes trap the bears.

The stock market has been characterized by exceptionally choppy price action over the last seven weeks. We witnessed the S&P 500 and the NASDAQ go nowhere for three months, spanning the final quarter of 2025 through January 2026. That directionless route is found a resolution to the bearish side as anticipated at the end of January when this publication anticipated “Cracks Under the Surface”. However, the most striking feature of the current market is the lack of conviction.
If you are a new trader feeling frustrated by the inability to find a clear trend as a bull or a bear, do not worry. This environment is uncommon. Usually, pullbacks are marked by solid bearish conviction candles that facilitate shorting, or bullish momentum markets that provide clear long entries. For several months, we managed to navigate this by focusing on individual names, but with the VIX around 30, the entire market is now presenting the same fragmented situation.
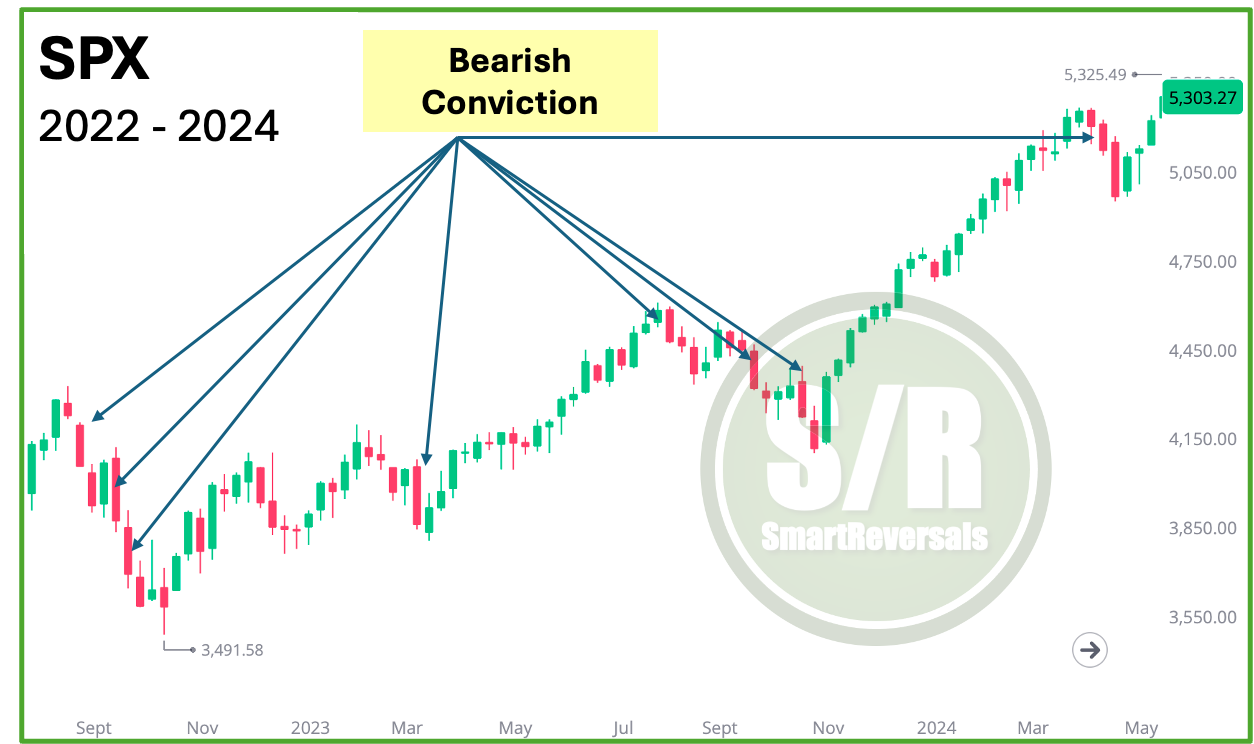
The Bearish Move has Lacked Conviction
See the last part of the 2022 bear market, the -10% correction in 2023, and the healthy pullback in 2024, the candles have a solid red body that show a clear move after the opening.
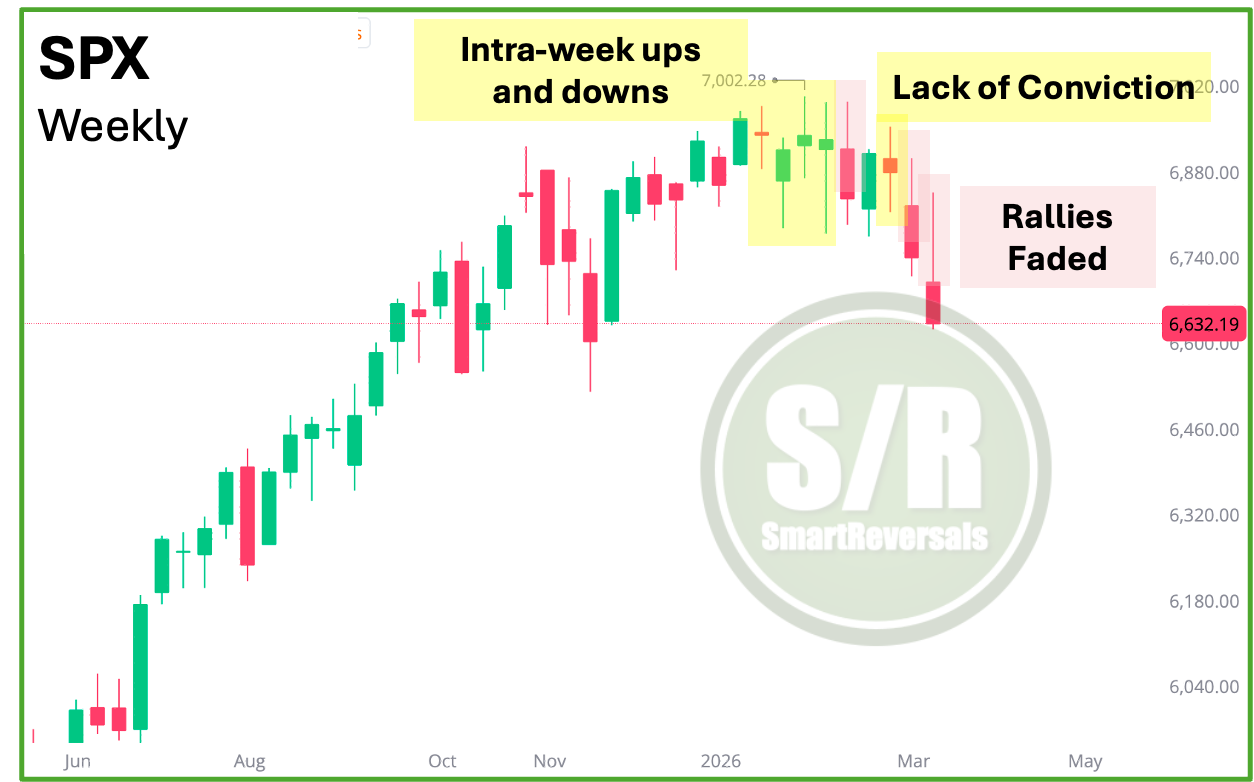
When analyzing the S&P 500 since the start of the year 2026, you will notice candles with long upper and lower wicks, reflecting massive intra-week volatility. Price action frequently reaches bullish targets, breaches essential validation levels, and touches bearish targets all within a single week. Recently, we are seeing “inverse U-turns” rallies at the start of the week that inevitably fade. While the resolution was neutral a few weeks ago, it has recently shifted toward a bearish outcome, with the index now declining 5% from its all-time highs.
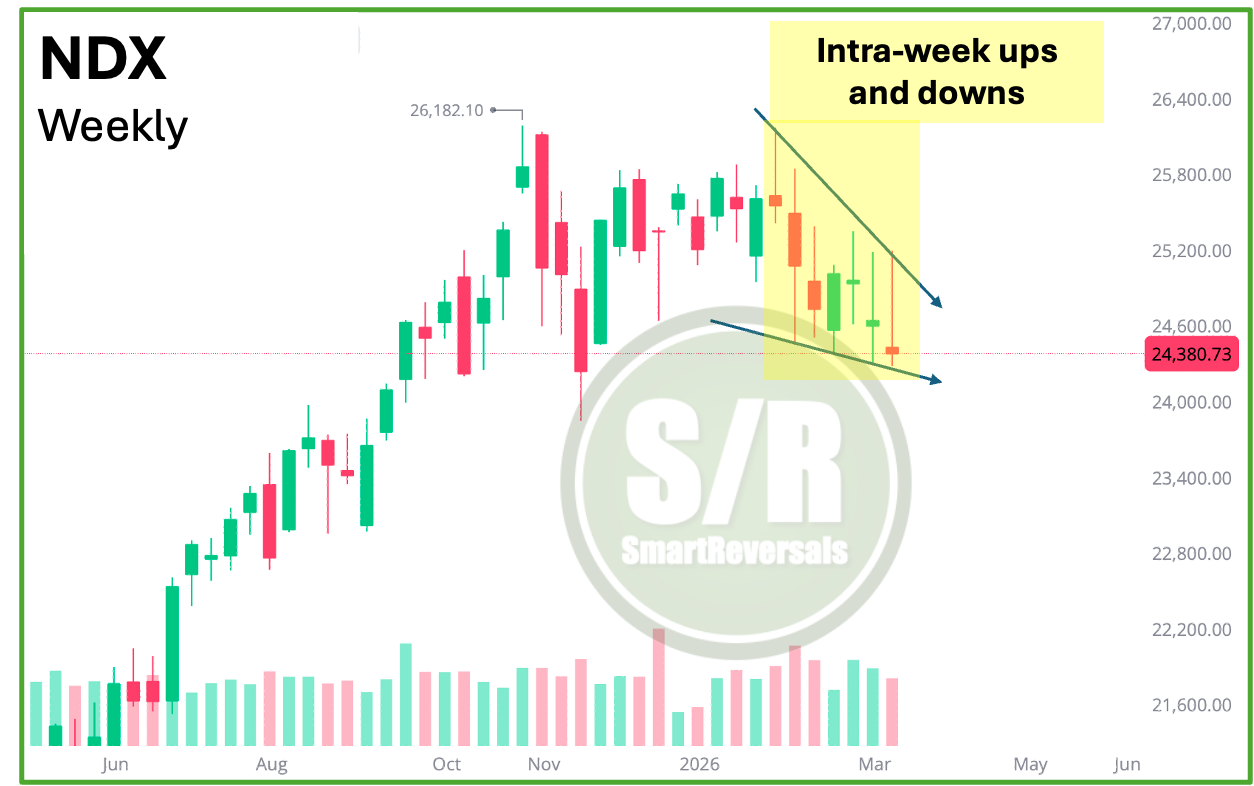
In the NASDAQ 100, the choppiness is even more pronounced. Instead of solid red or green candles, we see tiny “bodies” with long wicks to both sides. This convictionless price action exhausts both bulls and bears.
My publication from Wednesday, which I highly recommend reading, sets a clear macro and technical context regarding the geopolitical conflict with Iran and offers the references needed to navigate this environment. Starting today, I am adding a new combination of indicators to the Weekly Compass specifically designed to gauge the likelihood of 'choppy' regimes. These metrics will serve as a filter to determine whether to remain sidelined or adjust position sizing to navigate both bullish and bearish setups effectively. Access here:
This publication consistently analyzes the following securities to provide a broad market perspective and empower your trading decisions. Maintaining a consistent watchlist is key to improving performance; it allows you to refine the timing of your entries and effectively rotate capital as new opportunities emerge.
Indices & Futures: SPX, NDX, DJI, IWM, ES=F, NQ=F
ETFs: SPY, QQQ, SMH, TLT, GLD, SLV, DIA, VXX
Major Stocks: AAPL, MSFT, GOOG, AMZN, NVDA, META, TSLA, BRK.B, LLY, WMT, AVGO, COST, JPM, XOM, PLTR, NFLX, V, AMD
Crypto & Related: Bitcoin, Ethereum, ETHA, IBIT
Leveraged ETFs: TQQQ, SQQQ, UDOW, SDOW, UPRO, SPXS, URTY, SRTY
There are securities forming promising setups, unlock the complete analysis including technical charts, price levels to assess the strength of any potential spike in price next week, the potential levels where it can resume the selloff if the pattern continues, and how the price structure has been affected for the SPX and NDX.
Subscribe now to the paid plan, and unlock all the premium content.
Today’s Agenda
The Momentum Map: Analyzing the stage of every security in a single chart, Strategy for the week ahead.
Setups Blueprint: Entry levels for short and long setups with price targets and invalidation levels for all the securities in the watchlist prioritizing stronger setups.
Market Context: Technical charts and price levels for U.S. Indices, Volatility, Breadth, and Crypto.
Deep Dive: Individual analysis of Mega Caps and Metals (20+ charts).