20 Weekly Average Reached - Sustainable Bounce?
From FOMO to Fear: Navigating the Market's Turn - Key Levels to Watch
Bullish momentum has evaporated. The pullback many were looking for has arrived: the SPX has retraced -5.5% from its peak, the NDX declined -9%, and market darlings like PLTR and NVDA have shed -29% and -18.5%, respectively.
Only two weeks ago, the “stocks only go up” mantra was booming, unfortunately, market peaks are often defined by latecomers chasing velocity with leverage, only to be caught in the reversal. Technical indicators excel at identifying these overheated conditions. This publication previously flagged these risks for the mentioned securities and many more in pullback mode including mega-caps, Bitcoin, and indices.
For over 20 months, our backtested weekly and monthly support and resistance levels -specifically the “central weekly level”- have provided subscribers with objective validation for trend reversals when these key levels are breached. The week started below the central level for the indices and stocks like TSLA, META, AAPL, MSFT, and others permanently studied here.
While Friday saw a bounce from extreme oversold conditions on daily timeframes, the weekly picture requires a deeper look. Today, we focus on two essential aspects:
The Key Price Levels: The specific price or central level each security must reclaim to restore bullish momentum and validate Friday’s bounce (Premium subscribers saw on Thursday how that level was not conquered and where the selloff started).
Weekly Chart Analysis: Distinguishing between securities showing genuine potential for a bounce and those that remain vulnerable.
My watchlist includes the following securities:
Indices & Futures: SPX, NDX, DJI, IWM, ES=F, NQ=F
ETFs: SPY, QQQ, SMH, TLT, GLD, SLV, DIA, SH, PSQ
Major Stocks: AAPL, MSFT, GOOG, AMZN, NVDA, META, TSLA, BRK.B, LLY, WMT, AVGO, COST, JPM, PLTR, NFLX
Crypto & Related: Bitcoin, ETH, IBIT, MSTR
Leveraged ETFs: TQQQ, SQQQ, UDOW, SDOW, UPRO, SPXS, URTY, SRTY
You can access the updated support and resistance levels and stock market commentary posted last Friday here:
Why a Watchlist Matters
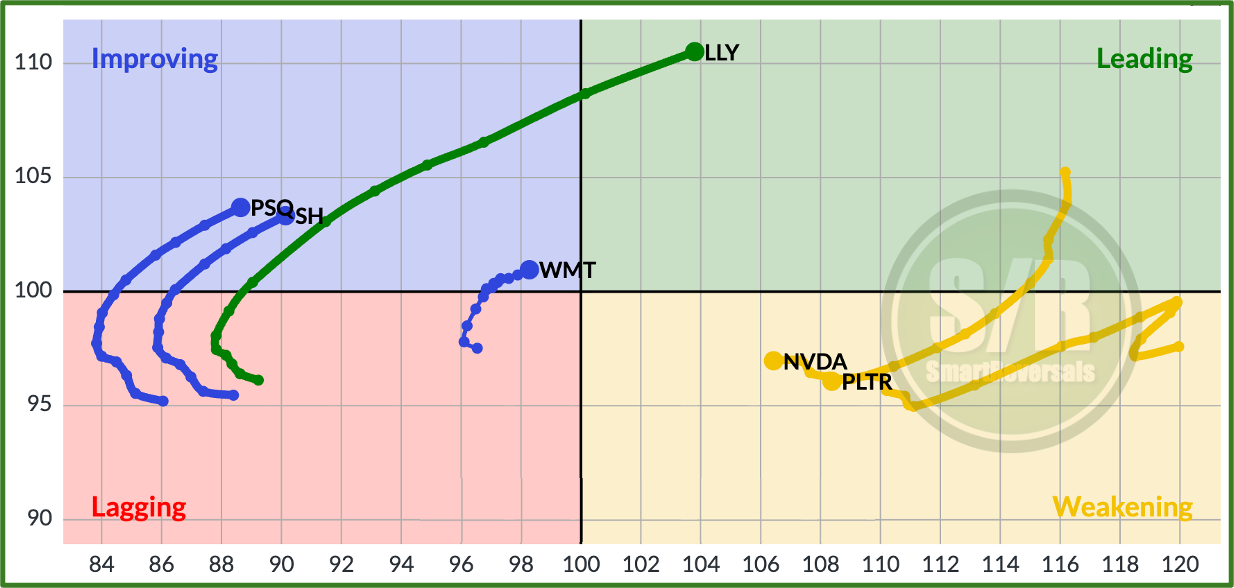
The purpose of a robust watchlist is rotation; bulls and bears alike can monetize opportunities in any environment. The Momentum Map used in this publication helps fine-tune these reversals and to assess continuation in a move. The recent moves in the map confirm what this publication anticipated:
LLY remains in rally mode (click here for the fundamentals posted).
NVDA and PLTR are correcting from overheated conditions.
WMT is showing relative strength, as suggested by our technical charts.
PSQ and SH have shifted into bullish momentum as considered last week (Inverse ETFs for QQQ and SPY).
Unlock the Momentum Map with full access to all securities, including individual charts and price targets. We have synthesized over 20 analyses to provide a clear menu of actionable alternatives. Starting today, all price levels include the percentage variance, allowing you to instantly measure the potential upside or downside of every security.
Find which stocks cryptocurrencies or ETFs are lagging or leading but with potential reversal setups, and which ones have bullish or bearish momentum.
Let’s begin with the analysis that includes the key indicators to navigate a potential bounce and how to validate it:
Full Momentum Map and SPX
Experienced traders have been waiting for this 5% pullback. It’s finally here. The question is: will you buy? Let’s look at the setups.


