
Bullish Resolution: Support Levels Now Steering the Rally
Support and Resistance Levels for the Week Ahead: U.S. Indices, Megacaps, Futures, ETFs, Cryptocurrencies

In a week where Wall Street's biggest players demonstrated their dominance, the Federal Reserve also made its first big move of the year. The central bank cut interest rates by a quarter-point, a decision that was widely expected but wasn't without its own set of internal debates. This move, which brings the new target range to 4% to 4.25%, is a clear signal that the Fed is concerned about a "really cooling off" labor market, as Fed Chair Jerome Powell put it. What does this mean for the market? It's akin to reducing the cost of borrowing to stimulate activity.
The stock market certainly seemed to take notice, with major indices closing the week at record highs. The S&P 500 (+1.2%), Nasdaq 100 (+2.2%), and DJIA (+1.05%) all hit new records. Anyway on Friday this wasn't a broad market rally. Instead, it was a "mega-cap" moment, where the biggest stocks did all the heavy lifting. This dynamic, known as negative market breadth, indicates that the overall market strength wasn't widespread. You saw this in smaller stocks, like those in the Russell 2000 (-0.8%), which gave back some of its recent gains. In fact, for every stock that went up, nearly two went down on the NYSE.
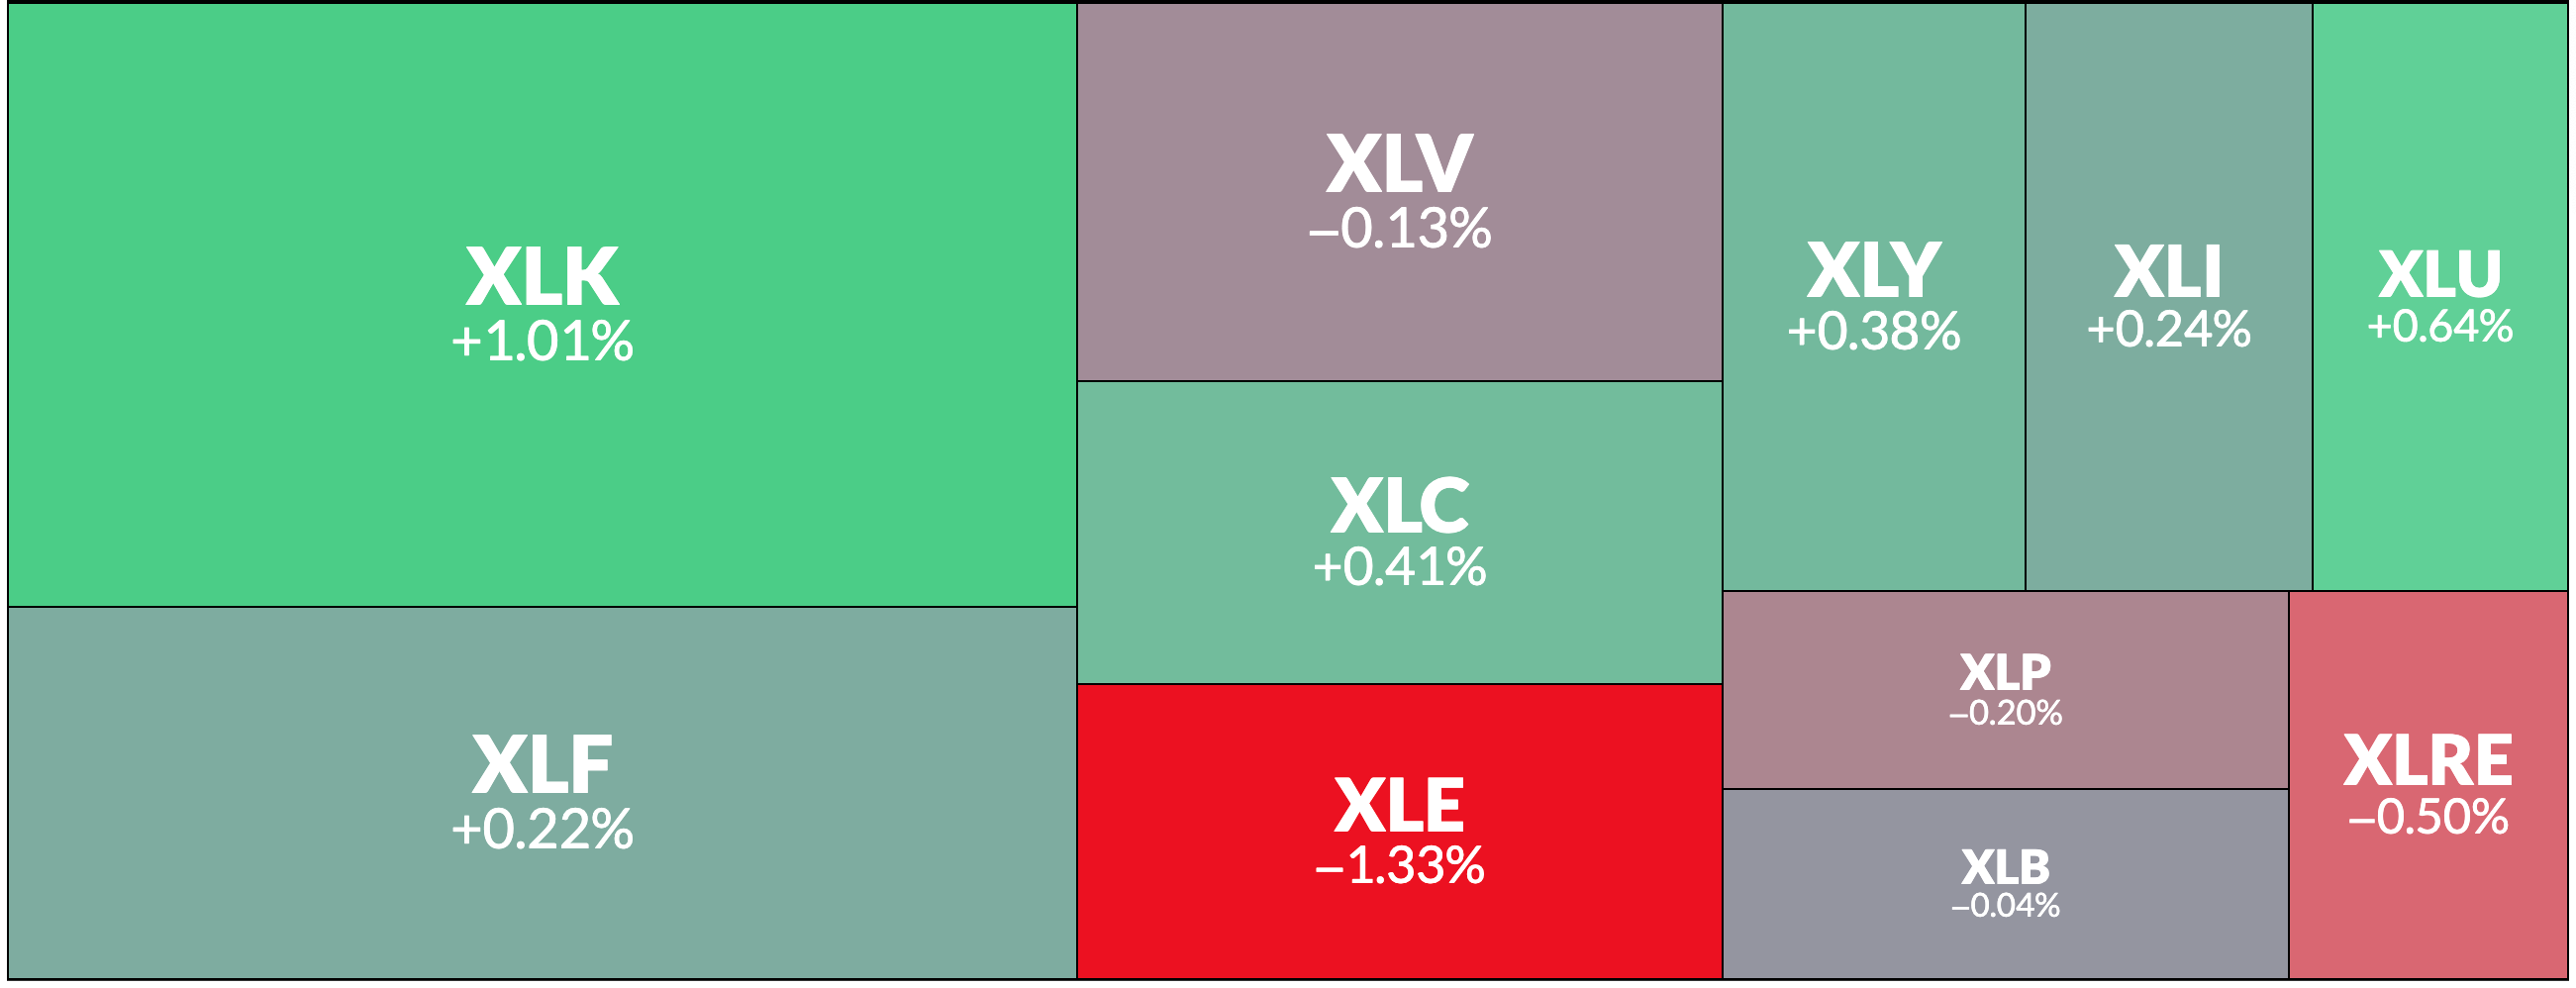
Today, the information technology sector (+1.01%) was a major contributor to the gains, with Apple (AAPL) leading the way. Its shares rose to $245.50, up 3.20%, fueled by positive reports about its new iPhone 17 lineup. Other tech giants, including Oracle (ORCL) and Alphabet (GOOG), also contributed to the sector's gains. However, it wasn't a clean sweep for every sector. Energy stocks, for instance, closed with a significant loss of -1.3%. Meanwhile, the bond market saw some action too, with U.S. Treasuries ending the week with losses. The yield on the 10-year note rose four basis points to 4.14%.
Last Wednesday, I published a must-read analysis focused on the special bullish conditions of the market in 2025. These conditions are so uncommon that only five other similar cases have been observed since 1970. The conclusions of the study are clear and should give you mental peace when a healthy pullback eventually occurs. In case you missed it or recently subscribed, the publication is here:
There have been several shooting star candles in both weekly and daily timeframes across the board. Gaps are open, the price has been above the Bollinger Bands for weeks, and the RSI has been above 70 in multiple timeframes for many securities, yet the price continues to rally for the SPX, NDX, SMH, IWM, GOOG, DJIA, and many more analyzed in this publication.
These sharp, parabolic rallies that invalidate warning signs have happened only a handful of times in the last 50 years. The publication from Wednesday (link above) gives you a clear reference for where we are in the current bull market. Spoiler alert: The easiest part of this rally is coming to an end, but this is still a bull market are we’re not far from a change in sentiment.
Today, the market is in a bullish mode for the very short term, and that remains the case until proven otherwise. Support and resistance levels have proven to be an accurate and valuable tool, as they provide tangible and objective warning signs once a price level is lost in a bullish trend. This was evident in February 2025, July 2024, and April 2024. This week for example, they were tested or neared, and the price bounced right from the key support zones: SPY from $654, QQQ from $583, DIA from $458.4, SMH from $301.6. The updated central levels for next week are below, get access now!.
This publication consistently analyzes the support and resistance levels for the following securities:
Indices & Futures: SPX, NDX, DJI, IWM, ES=F, NQ=F
ETFs: SPY, QQQ, SMH, TLT, GLD, SLV, DIA, SH, PSQ
Major Stocks: AAPL, MSFT, GOOG, AMZN, NVDA, META, TSLA, BRK.B, LLY, WMT, AVGO, COST, JPM, PLTR, NFLX
Crypto & Related: Bitcoin, ETH, IBIT, MSTR
Leveraged ETFs: TQQQ, SQQQ, UDOW, SDOW, UPRO, SPXS, URTY, SRTY
Subscribe now, unlock all the levels for next week, and remember to comment at the bottom of this publication what are the suggested securities for next week. I model the S/R levels for stocks suggested by paid subscribers and the results are posted on Sundays in the paid subscribers chat, access here:

As a premium subscriber, you have access to two essential libraries at SmartReversals.com. The first features in-depth stock market studies with valuable educational content, while the second is a complete guide to the fundamental analysis of over 50 companies, including trade ideas (APP, HOOD, and DASH rallied after the latest calls between +8% and +12% already). The guides to these libraries are open to everyone and are worth the subscription alone. They are also constantly updated to ensure you have the latest information at your fingertips. Check them out:
Unlock all the content with the premium subscription.
Let’s continue with the S/R levels for next week, for new premium subscribers, here are the guidelines to use Support and Resistance levels for the week and month:
Confluence - Find High Probability Setups Combining Indicators
Mastering Options (Since the levels are useful for short term trades)
WEEKLY LEVELS