
Bulls Seize Control, Triggering a Rare Technical Signal
What this signal could mean for the market's next major move - S/R Levels for next week - 44 securities including indices, futures, stocks, ETFs, and Crypto.

Since April, I have been documenting the high probability of a new bull market, also responding doubts from premium subscribers asking for my opinion on various bearish analysts interviewed on CNBC back then. I’m glad I helped to mitigate the noise.
As early as May, when many were still doubtful, I outlined the specific reasons why the rally could reach the $6,486 level for the S&P 500. My rationale is always documented with charts, which you can review in the publications linked below:
Was the $6,486 level expected to be the end of the bull market?
Premium subscribers already know the answer: No. There is more to come for this bull market, and what may look like a postponed pullback is actually part of a larger bullish structure.
The $6,486 price target has been on my S&P 500 charts since April 🎯, along with the following key levels:
$122,7K for Bitcoin 🎯
$521 for MSFT 🎯
$177 for NVDA 🎯
$220 for GOOG (recently surpassed) 🎯
$173 for PLTR 🎯
$1,250 for NFLX 🎯
$299 for SMH 🎯
$46,300 for Dow Jones 🎯
$23,654 for NDX 🎯
All of these price levels have now been reached, even though they seemed extreme just five months ago.
These annual levels often act as resistance, preceding consolidations or reversals. This pattern has played out with MSFT, Bitcoin, PLTR, NFLX, SMH, NDX, and several others, as seen in the charts I post weekly. For the S&P 500, the $6,486 level triggered a four-week flat consolidation. Despite overheated conditions and deteriorating market breadth
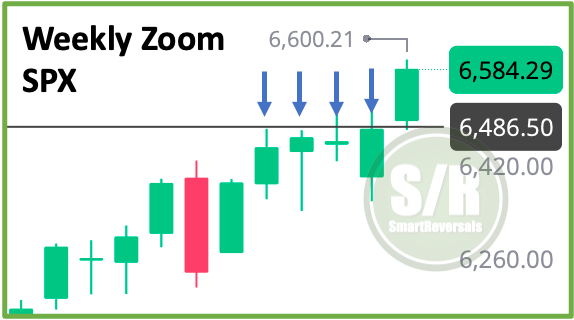
Powerful rallies from individual stocks like GOOG, AAPL, AVGO, and ORCL kept the indices afloat. while breadth deteriorated. A bounce observed on Thursday in the percentage of stocks above their key moving averages signaled that the market had reset "under the surface." This underlying strength then fueled the S&P 500's move above that key annual level, flipping solid resistance into new support.
This bullish resolution occurred despite some bearish weekly and daily setups. This highlights the value of the S/R levels and a key rule I follow: "bullish above the central weekly level, bearish below it." This simple rule should have kept you in the long side this week preventing premature decisions since $6,458.2 and many other central levels maintained their positions as support.
The S/R levels, and specifically the central level is the most effective tool I can provide for navigating the 50+ securities we analyze each week (44 constant securities and 10 more suggested by subscribers every week).
That said, the Support and Resistance levels for next week are here for the following securities, if you trade one or some of them, this publication is for you:
Indices & Futures: SPX, NDX, DJI, IWM, ES=F, NQ=F
ETFs: SPY, QQQ, SMH, TLT, GLD, SLV, DIA, SH, PSQ
Major Stocks: AAPL, MSFT, GOOG, AMZN, NVDA, META, TSLA, BRK.B, LLY, WMT, AVGO, COST, JPM, PLTR, NFLX
Crypto & Related: Bitcoin, ETH, IBIT, MSTR
Leveraged ETFs: TQQQ, SQQQ, UDOW, SDOW, UPRO, SPXS, URTY, SRTY
For the 10 customized analysis for the week, remember to comment at the bottom of this publication and I’ll post them on Sunday in the Chat or in a forwarded version of this publication.
We reached the 50 likes last week, but didn’t make the 20 reposts, anyway I appreciate people who tried constantly during the last weeks, so @swingtraderfxcripto and @sesica send me your emails via DM for 2 week free access to all the content.
Subscribe and unlock all the content of smartreversals.com, including the library of market insights plus education for traders and investors. The most recent publications with fundamental analyses are:
Fundamentals for Semiconductors: NVDA, AVGO, TSM (Bullish target for AVGO reached 2 days after the publication).
With that in mind, let’s continue with the S/R levels for next week, and stay tuned during this week for the first section of my eBook focused on Technical Analysis.
For new premium subscribers, here are the guidelines to use S/R levels:
Confluence - Find High Probability Setups Combining Indicators
Mastering Options (Since the levels are useful for short term trades)