
Get Ready for the Busiest Week of Earnings Season Next Week
S/R Levels July 28th - Aug 1st: U.S. Indices, ETFs, Stocks, Metals, and Crypto.

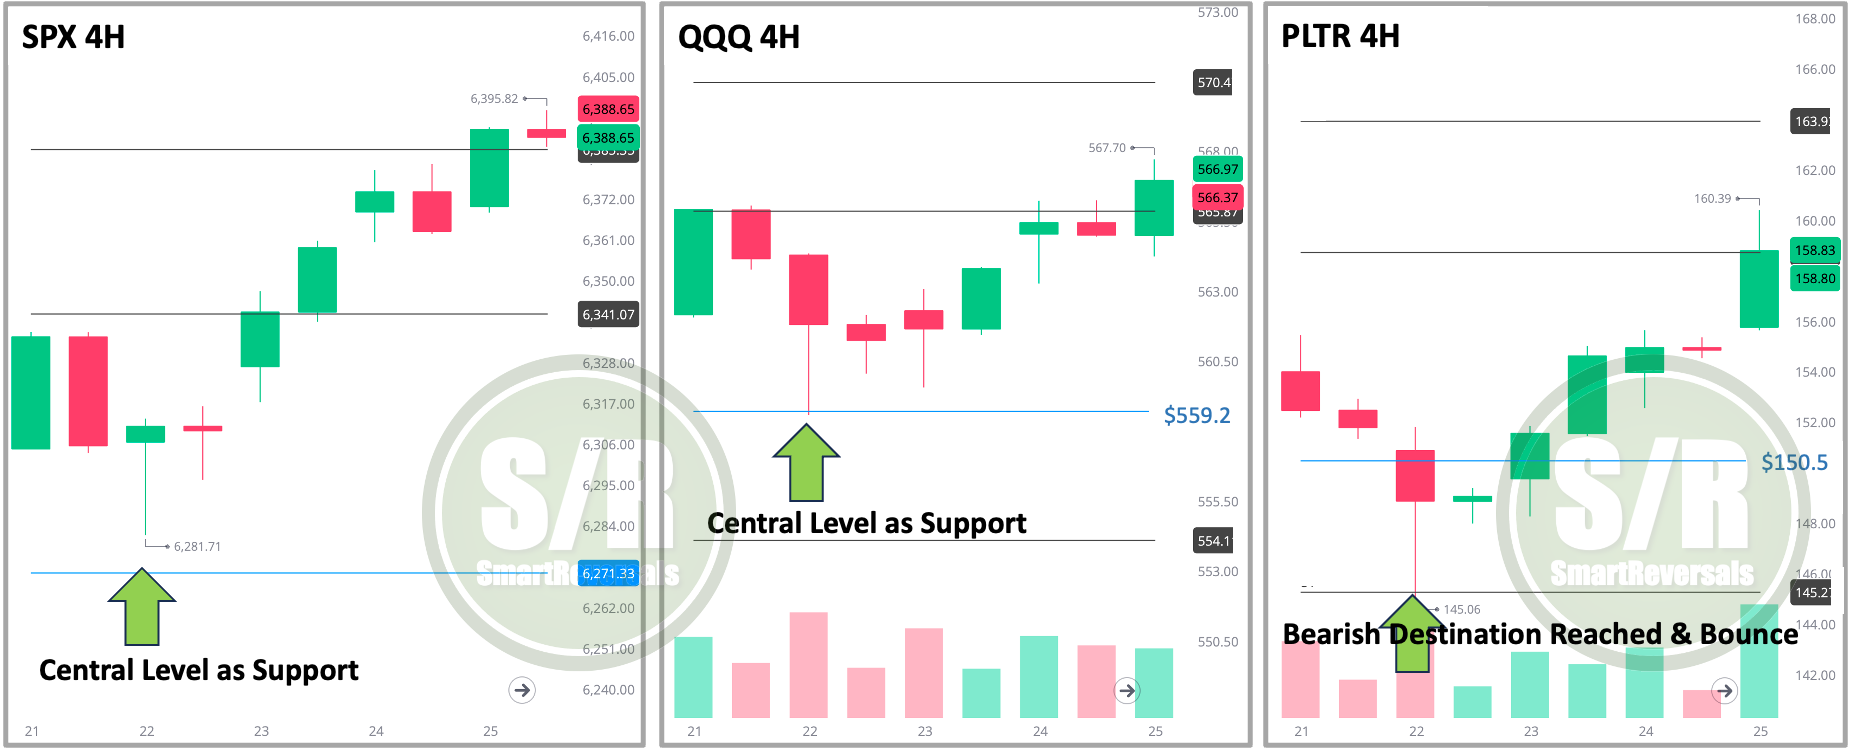
The Support and Resistance levels proved highly relevant for the week that just ended, let’s analyze the price action for SPX, QQQ, and PLTR, as observed on these 4-hour charts. The 4H and 2H are the ones I normally use, but you can use shorter timeframes as long as you combine more technical indicators to reduce the risk to fall in fake moves.
For SPX, after opening the week above its central level (the blue line), the price reached its first resistance zone, or bullish target, by Monday at 1:30 PM. This triggered a decline towards the central level, specifically around 6,271.3. These levels can act with remarkable precision, as seen in the following case for QQQ, or they can function as zones, which was the case for SPX as its weekly low remained 10 points above the central level. This bounce, which formed a bullish 4-hour candle by mid-Tuesday, initiated a robust rally that persisted throughout the week. Price extended well beyond its initial range, breaching previous resistance levels. By the close of the week on Friday, SPX was trading higher, above its second resistance level, clearly demonstrating the efficacy of the central support in validating bullish momentum confirming a new upward trend after the initial dip.
The latest 4-hour candle printed this Friday afternoon indicates indecision; however, any signal of a potential reversal at this moment must be validated to avoid a premature decision. This is a critical period for the stock market, as the price is overbought, yet seasonality and optimism regarding economic news have fueled further momentum. That said, once the central weekly level is breached, we will have clearer references to consider a healthy pullback as potentially underway, not before. The central level for next week is provided below for SPX and 40+ securities. Let's now examine QQQ and PLTR for more examples of the precision of these levels before sharing the updated levels.
QQQ also found strong footing at its central level as support at $559.2 on Tuesday morning. This level provided a critical bounce, leading to a sustained bullish move throughout the week and confirming the newfound upward momentum.
As long as the central level continues as support any potential reversal formation is not confirmed and it is potentially invalidated.
To access the previous Weekly Compass, use the link below:
PLTR, the chart above shows a the bearish target mentioned in the weekly compass last week and a bounce with precision from $145, indicating that price hit a significant support zone before reversing sharply upwards. This strong bounce from a predefined bearish target suggests that key support levels were successfully identified and held, leading to a significant bullish reversal.
Across all three securities, the designated support and resistance levels, particularly the "central levels," played a key role in dictating price reversals and confirming new trends throughout the trading week. These movements underscore the predictive power of these analytical tools in identifying potential turning points and directional shifts in the market.
To gain a similar edge and anticipate these critical price movements, consider subscribing to unlock the precise support and resistance levels for the upcoming week, ensuring you're prepared for the next wave of market opportunities
I have written educational content to master the use of the support and resistance levels, once subscribed in the paid plan, the access to all the links and content is granted.
Last but not least, my latest educational content offers a deep dive into options, a topic highly correlated with support and resistance levels. A move of just one or a few points in a security's price can be significantly amplified with leverage, as long as the investor or trader has the necessary technical knowledge, discipline, and risk management.
This publication consistently analyzes the following securities to provide a broad market perspective and empower your trading decisions using Support and Resistance levels that have proven to frame the price action for the following week and anticipating potential reversal zones:
Indices & Futures: SPX, NDX, DJI, IWM, ES=F, NQ=F
ETFs: SPY, QQQ, SMH, TLT, GLD, SLV, DIA, SH, PSQ
Major Stocks: AAPL, MSFT, GOOG, AMZN, NVDA, META, TSLA, BRK.B, LLY, UNH, AVGO, COST, PFE, PLTR, NFLX
Crypto & Related: Bitcoin, ETH, IBIT, MSTR
Leveraged ETFs: TQQQ, SQQQ, UDOW, SDOW, UPRO, SPXS, URTY, SRTY
WEEKLY LEVELS
The first blue column displays the new central level for each security; maintaining bullish momentum is more likely when price action remains above these levels. The second blue column, includes red characters for some securities, they show the percentage jump required for the price to recover its central level next week. This indicates current weakness, which must be invalidated by regaining the 'blue' level to provide references for bullish continuation, COST, NFLX, UNH, MSTR and IBIT are some examples: