Over the past few weeks, I have closely monitored the Volatility Index (VIX) and the Nasdaq 100 (NDX). The VIX flashed its initial warning sign when October started, and I called for an imminent volatility bounce during the next days based on a transparent indicator signal. The following week, the NDX was forming a top by breaching key bands and retracing. Since then, major supports have failed. This started with the 20-week moving average for both the NDX and SPX, along with by key annual levels like 29,036 and 7,638 respectively.
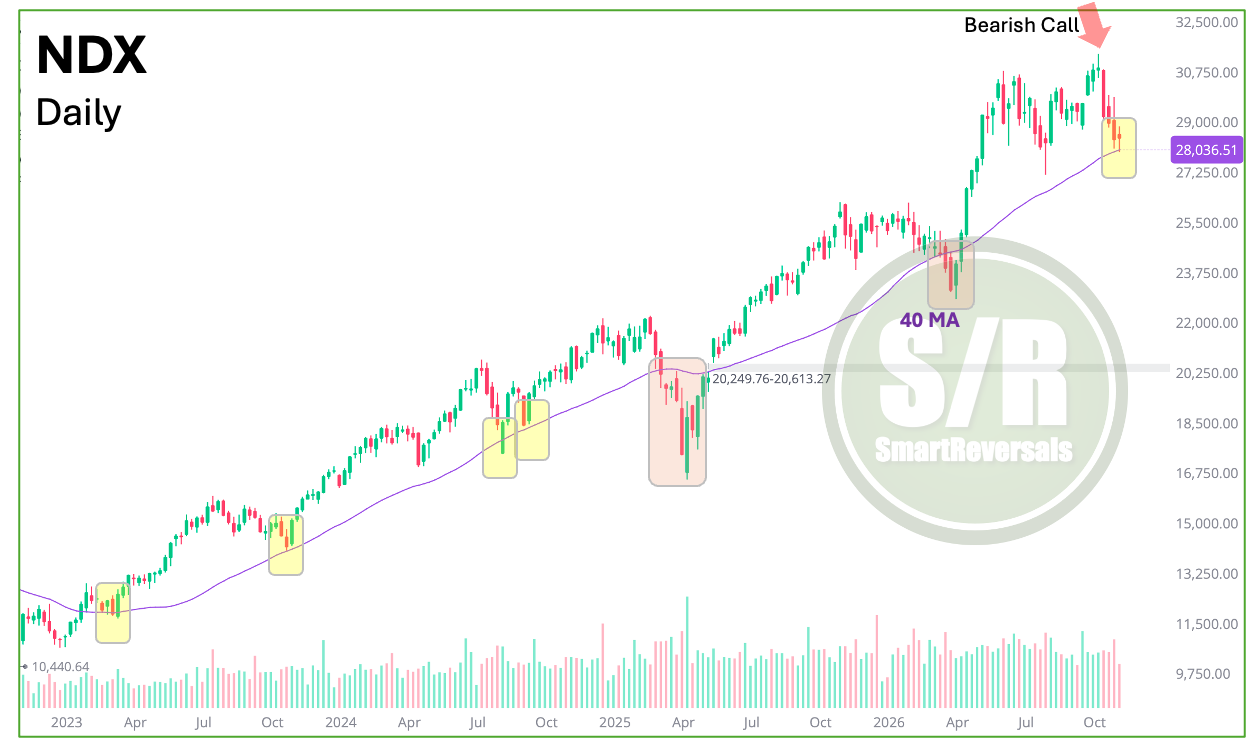
In last Thursday’s update, “The Most Important Chart of the Week,” I noted the impulsive behavior in tech using the NQ futures and the high probability of a test at the 40-week moving average. That level was tagged today for the NDX, establishing a critical structural checkpoint. The question now is whether this flush can hold as a sustainable bottom.
Both the SPX and NDX bounced today, recovering the 7,638 annual level for SPX, which sits in confluence with other key monthly lines and moving averages described last Saturday, creating a constructive setup. Tech must now reclaim its own key levels, especially since the 40WMA has acted as a major bounce zone just as it has in previous pullbacks since 2023. Losing that moving average has made the difference between a pullback and a double digit correction.
Today we will analyze key levels and indicators to watch. The bounce vanished in the afternoon with the SPX showing strength, but the NDX lost conviction, and the semiconductors index SOX lost momentum ending in deep red.
My Investment Framework includes Fundamental Analysis, Momentum Map, Technical Analysis, Modeled Support and Resistance Levels and tracking.

All of this applies directly to the tickers on our watchlist, and most companies are updated in the fundamental library, AAPL, PLTR, and AMD are ready to download:
Indices & Futures: SPX, NDX, DJI, IWM, ES=F, NQ=F
ETFs: SPY, QQQ, SMH, TLT, GLD, SLV, DIA, VXX
Major Stocks: AAPL, MSFT, GOOG, AMZN, META, TSLA, SPCX, LLY, JPM, XOM, PLTR, NFLX, V, AMD, NVDA, WMT, AVGO, COST.
Crypto & Related: Bitcoin, Ethereum, ETHA, IBIT
Leveraged ETFs: TQQQ, SQQQ, UDOW, SDOW, UPRO, SPXS, URTY, SRTY
Upgrade to a paid subscription to access this daily update and the Weekly Compass for this week featuring technical analyses, modeled price levels, and setups for this week. get access here:

A subscription also unlocks the full Fundamental Research Library, updated with institutional approach for AMD, AAPL, PLTR, including 1-, 3-, and 12-month price targets and catalysts to monitor. Get access here:

Finally, you can access my complete Market Intelligence and Educational Library right here, which includes two downloadable ebooks.

Unlock all the content by subscribing to the paid plan now:
Today’s Agenda
Watchlist Tracker
Fundamental Analysis for AMD, AAPL, and PLTR
Daily and Weekly Levels Combined for SPX, ES=F, AMZN, AMD, PLTR, AAPL, QQQ and more.
Daily plan for SPX, ES=F
Let’s begin.
Watchlist Tracker
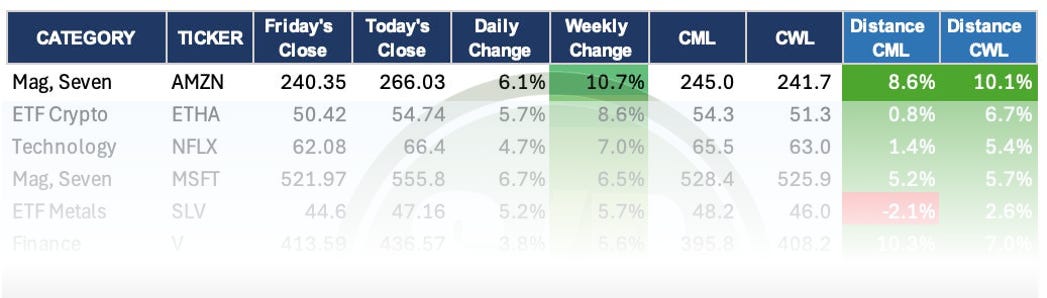
From the high probability setups posted on Saturday, AMZN has pinned a stellar confirmation exceeding targets with a +10.7% weekly move so far, GOOG is constructive reached its target (CWL) 292.2 (+5%) and retraced a bit keeping the green with a 3.3% weekly move, QQQ bounced to 700 once again today and SPX recovered 7,622 and reached 7,716 as the first bullish target for the reversal.
GLD and SLV rallied after the elections results, the tactical bounce considered during the weekend is happening in a choppy way, but they flipped both their central Monthly and Central Weekly Level.
NFLX was not in the high probability setups, but it has been constructive this week, that’s the objective of tracking all the names in the watchlist, today the stock is working in the gap fill that I anticipated when it was open. Let’s study the levels for the outstanding tickers.