
Major Top In, or Healthy Pullback?
Technical Indicators Warned About this Reversal - Key Levels to Watch


The market finally broke below the weekly central level, a development that was likely given the warning signs raised in last Wednesday's edition (click here). Today, the S&P 500 (SPX) is below last Wednesday’s price with technical conditions suggesting that the decline has just began.
In today's edition, we will delve into breadth indicators, including the McClellan Oscillator, New Highs-New Lows, and the McClellan Summation Index. This analysis will be complemented by updated technical analysis for DJI, SPX, NDX, PLTR, BITCOIN, GLD; along with updated price moves relative to support and resistance levels for all the other securities featured in the Weekly Compass (IWM, SMH, SLV, TSLA, NVDA, AAPL, META, GOOG, AMZN, MSFT, and NFLX). If you invest or trade in one or some of those securities, this publication is for you.
For today's update, it is important to review the previous Weekly Compass edition (click here) and the Support and Resistance Levels for this week (click here).
Additionally, you can access educational content about breadth indicators in our educational library:
Upgrading your subscription to premium/paid grants you access to all the content mentioned and, in general, all publications posted at www.smartreversals.com.
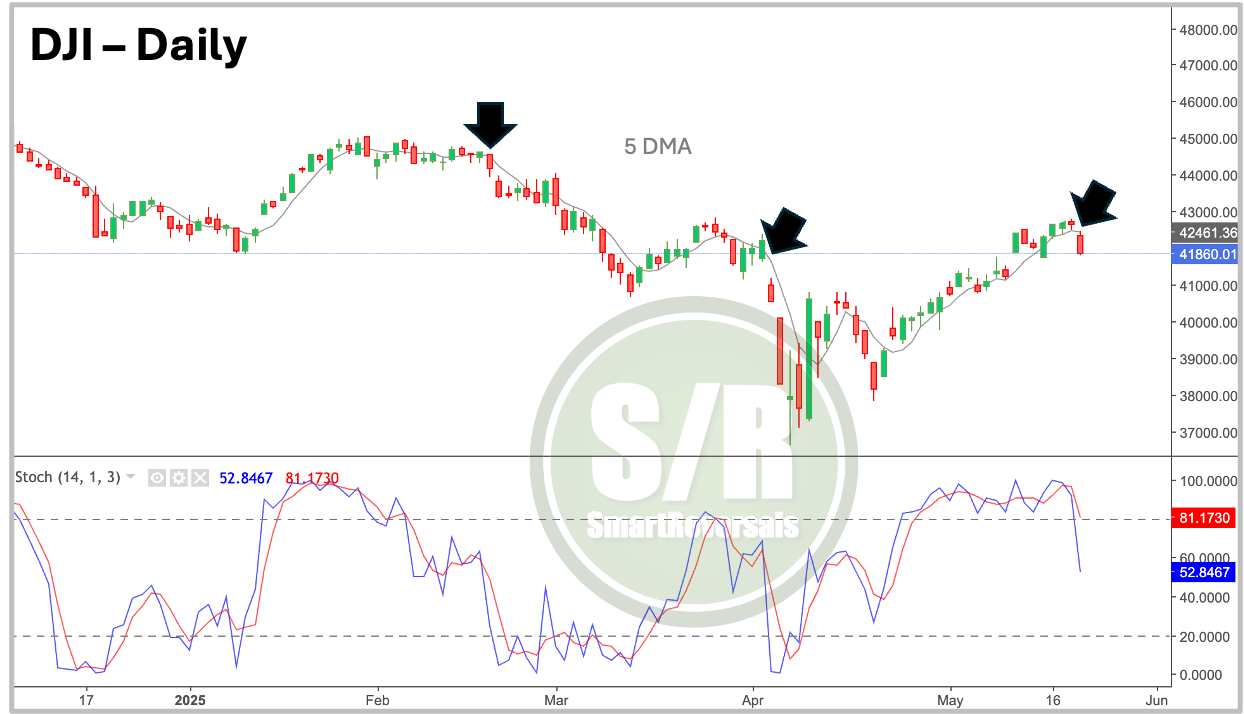
Dow Jones (DJI): With a -1.9% decline for the day, the $42.3K central weekly level was breached, validating a bearish reversal that already crossed the minimal bearish target of $42.9K. The latest candle has already breached this support, indicating conviction today and a potential visit to $41.5K, unless $42.9K is quickly recovered. The chart reveals a bearish crossover in the Stochastic oscillator and a loss of the 5 DMA (previous events highlighted), suggesting this might be merely the beginning of the downward movement and the final destination is below the levels mentioned.
Is This a Major Top... or a Healthy Pullback?
In the previous Weekly Compass, we commented about pullbacks observed in bounces during 2020 and 2018, but also on Sunday, premium subscribers received a chat analysis of previous credit rating downgrades in 2011 and 2023. In both instances, a -10% correction ensued. Consequently, we will now examine what the breadth indicators are signaling.
The technical analysis for the SPX alone includes four charts, to determine if we are experiencing a similar bounce or if the stock market has just concluded a bear market rally, in any case the decline just began considering an essential indicator that is charted below.
Let’s begin.
SPX - Breadth, Technicals and Volatility: