

The bearish thesis for the major indices posted on Saturday was confirmed today; the SPX opened below the central daily and weekly levels, setting a bearish momentum right from the start. The daily level (CDL) of 7,657 was lost from the opening and the price found support at 7,596.5, a support layer provided on Friday.
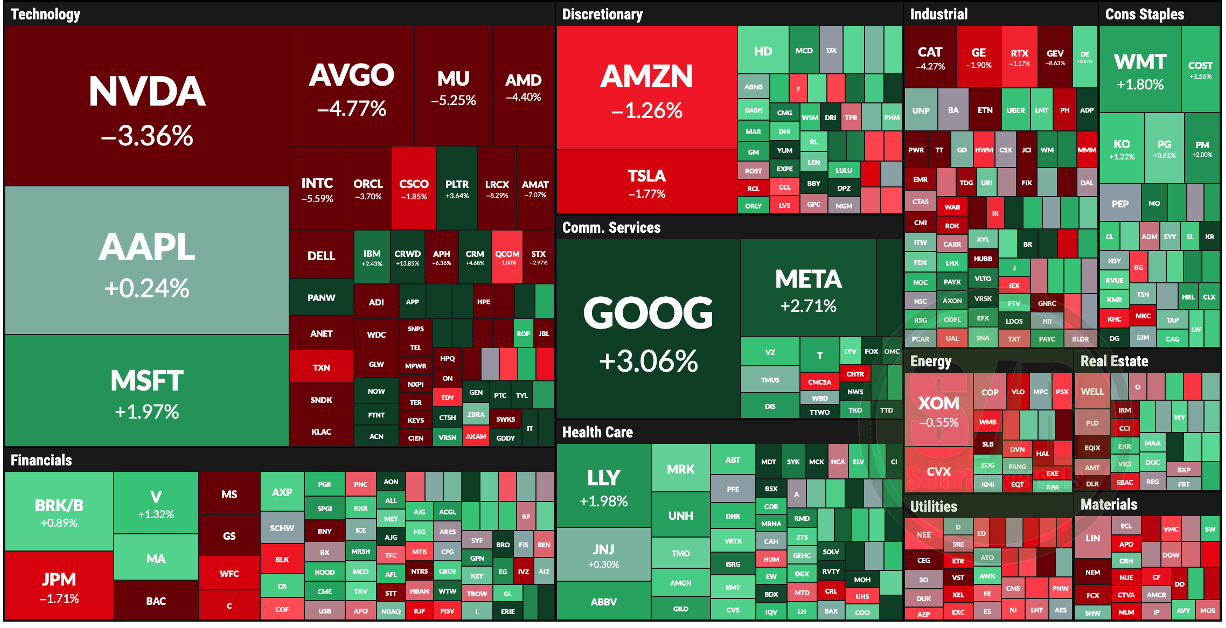
The day was red for semiconductors, but it was not as ugly for the stock market in general. Individual names that I mentioned on Saturday as valid bulls like META, GOOG, and AAPL, showed strength or resilience today. Among the setups highlighted with the highest probability to occur and reach their targets, NFLX and WMT started the week in the expected direction: WMT rallied as anticipated, reaching close to 109.9 🎯 as a weekly target modeled last Friday. That area acted as resistance, and the stock closed up +1.8% for the day. NFLX rallied 3.8% as a high-probability bullish setup, crossing the bullish target of 79.4🎯 and getting very close to 81.1, which was the next weekly bullish target modeled last Friday. Meanwhile, SPX/SPY, DIA, and IWM started the week bearish as anticipated on Saturday 🎯.
Building on last week’s daily notes, I covered how to manage high-probability setups, how to read the setups blueprint, and what to consider when a bullish target closes the day as resistance for longs versus closing as support. The same principle applies to short positions: when a target holds as support by the end of the day, contrasted with when a level is breached and closes the day as resistance after previously being support. We closed the week with seven key learnings included in the S/R levels edition, get access to these guides using real life charts:


Last week, we studied how to manage momentum when a bullish probability setup opens with a gap up, as well as how to manage bearish probability setups when the price opens with a gap down using AMD and DIA as case studies.
Today, we are looking at AMD again, specifically the opposite scenario: how to manage a bullish setup when it opens below the central weekly level (CWL). Again, please make sure to review last week’s guidance, the content goes straight to the point, and uses real life charts.
What You Get as a Paid Subscriber
When you upgrade to the paid plan, you unlock three core publications each week, along with exclusive member benefits:
→Wednesday: Market Intelligence and fundamental analyses.
→Friday: Support and Resistance Levels for the week ahead.
→Saturday: The Weekly Compass, featuring an in-depth technical immersion.
In addition to our weekly publishing schedule, your membership includes three immediate advantages:
→ Instant Ebook Access: Download my two foundational technical analysis ebooks directly from the Market Intelligence Library. (click here)
→Daily SPX & ES=F Levels: Receive daily levels assessing short-term momentum and potential reversal signals.
→Customized Level Modeling: Every Sunday, submit your watchlist stocks in the paid subscriber chat. Their specific institutional levels are modeled for the week ahead and published directly to the site.
All content is available at SmartReversals.com.
→Founding Members: Subscribers in this tier receive a daily downloadable excel file at 6PM every day featuring key daily levels for all tickers in our regular watchlist, plus an expanded watchlist covering 40 additional popular tickers. This package includes a comprehensive daily market analysis, an expanded Watchlist Tracker, and SmartScreener results delivered every Sunday to prepare you for the week ahead. The customized Weekly levels include Monthly Levels and are downloadable in an Excel file. All of this is updated in one place: the Founding Members Exchange Hub.
Today’s Agenda
Managing Setups Below CWL: AMD Case Study
Daily Plan for SPX, ES=F
Combined Levels for Tomorrow: , SPX, ES=F, NVDA, AVGO, AMD and MU
Watchlist Tracker
Let’s begin.