
Powell Blinks and Stocks Soar - Is it Sustainable?
Is the Pullback Over? Key Charts and Levels That Suggest Not Yet

Investors got bullish signals, as Fed Chair Jerome Powell indicated that central bank policymakers are open to cutting interest rates at their meeting next month, though perhaps not as aggressively as some had hoped. Lower rates should help sustain the market's summertime rally, especially after recent weakness in the jobs market and worries about AI spending had slowed the bulls.
Powell told the Jackson Hole conference that "the baseline outlook and the shifting balance of risks may warrant adjusting our policy stance," signaling that rates could be cut as soon as September. This would mark nine months since the Federal Reserve's last rate cut.
Historically, such pauses have been good for stocks. When the Fed has waited 5 to 12 months between rate cuts, the market was higher a year later in 10 out of 11 instances.
Regarding the pullback that started during the week that just ended, I studied the price action from different perspectives for this publication, as you know, when there is an unexpected move I don’t fight the tape, I study more.
You will find below two charts with specific metrics and formations that suggest the pullback in the middle of this bull market is not over, and as usual, I provide specific price levels to validate that thesis, so once those levels are lost, the chances for a decline increase, as it happened during the week when the SPX lost $6,431, or the NDX didn’t even make it above $23,721.8 and for the record, that level was not reached after the rally. The following heat map presents the price variation during the last 5 days, and you can tell how weak has tech been while the gains have been driven by other sectors like Energy (XLE gained +3% during the week), Real State (XLRE +2,4%), Materials (+2,4%), and Financials (XLF +2,1%) as part of the group of sectors rallying more than 2%; Industrials, Healthcare, and Consumer Discretionary gained more than 1% during the week.
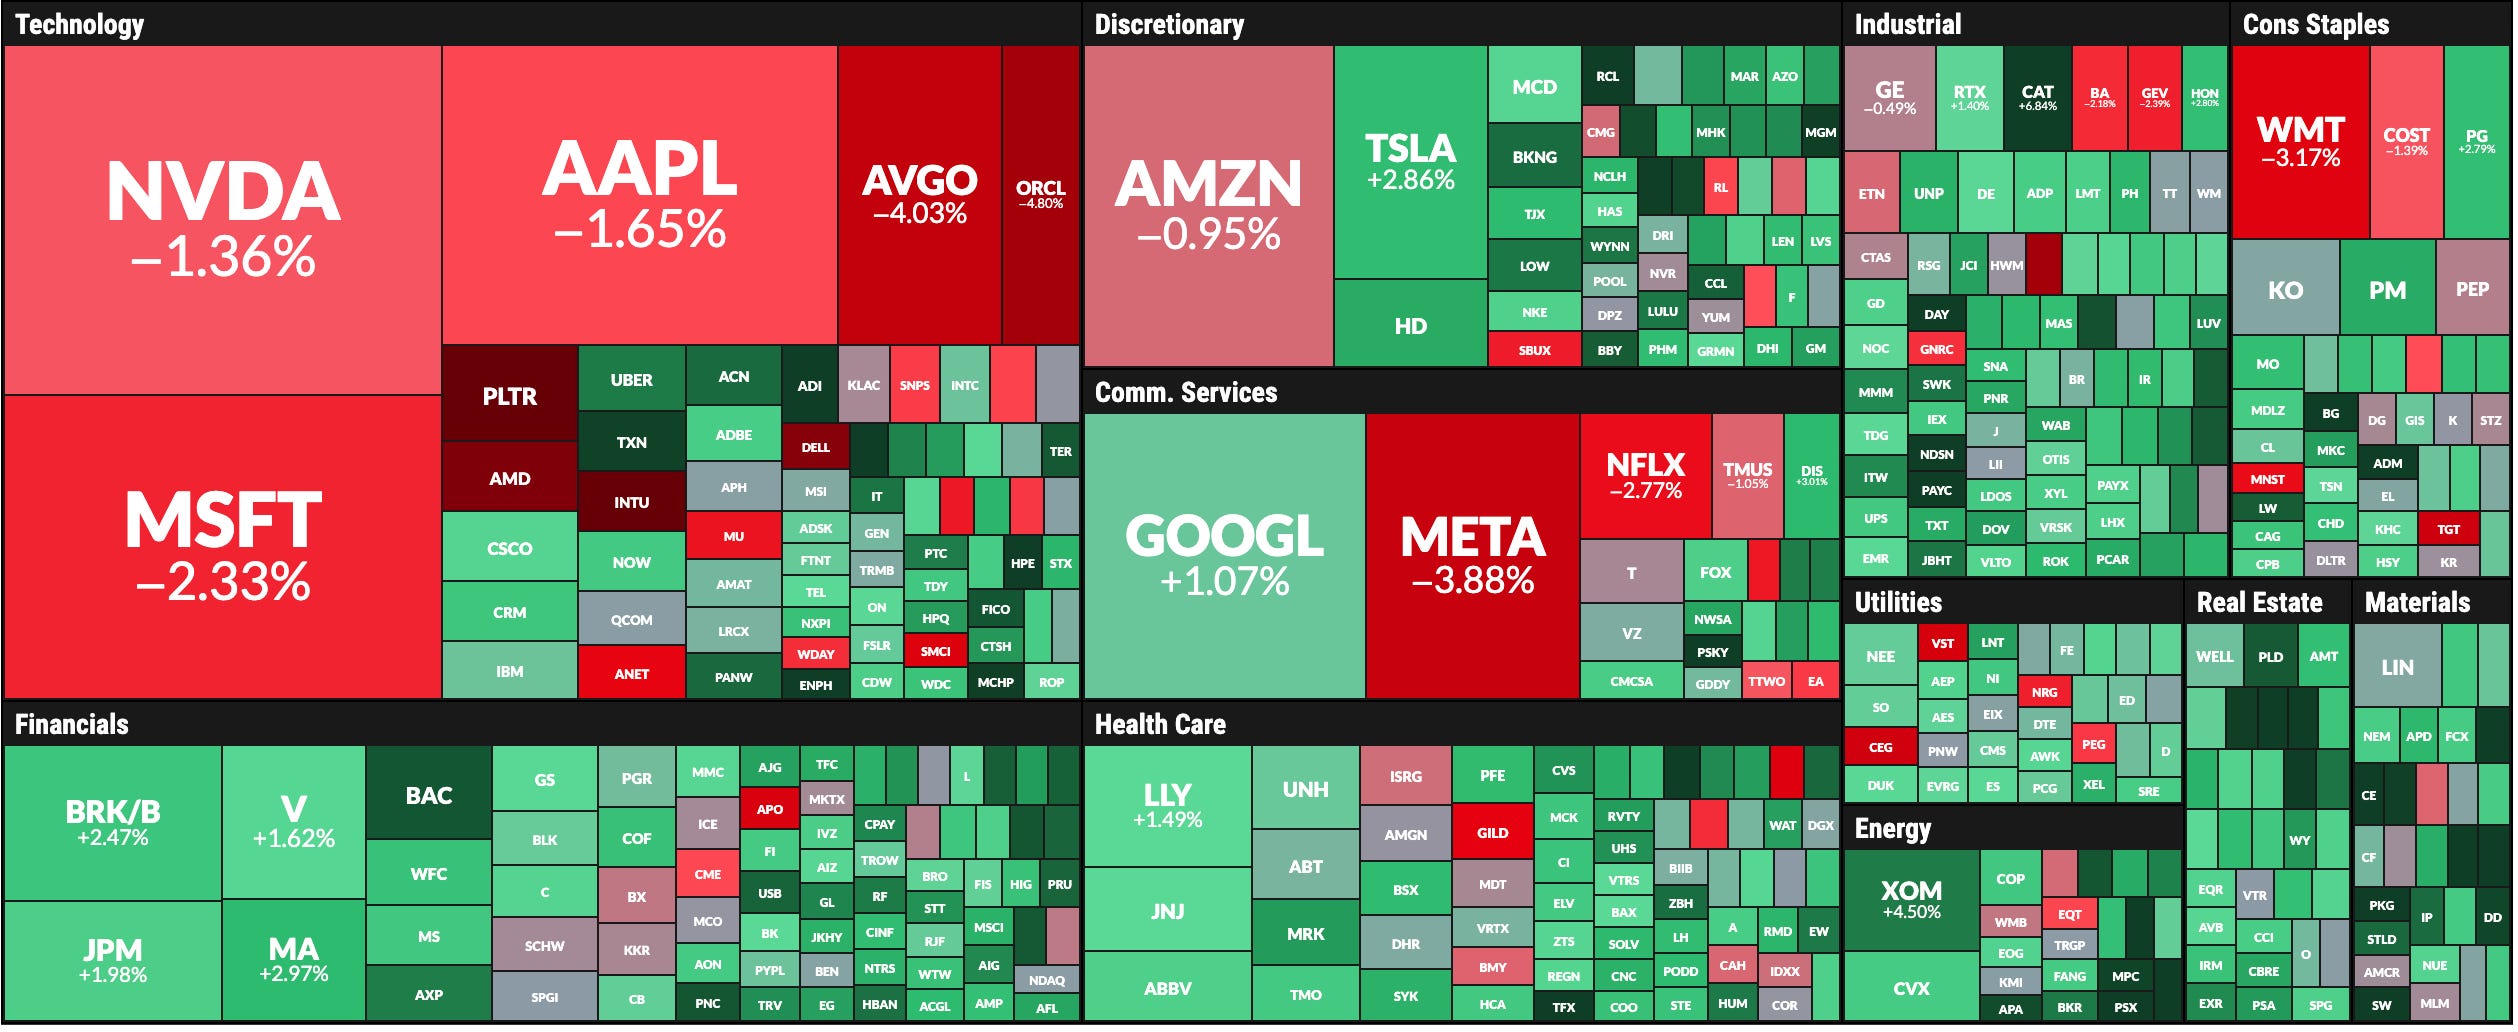
There is a clear rotation in the market, tech is overheated and the big players closed the week still in the red despite of the Friday’s rally.
Today’s content includes the following charts as part of the regular agenda: SPX, VIX, NDX, Dow Jones, IWM, SMH, GLD, SLV, TLT, BRK.B, PLTR, NFLX, GOOG, AAPL, TSLA, NVDA, META, MSFT, AMZN, Bitcoin, Breadth analysis, and two additional charts for SPX that speak by themselves and suggest the pullback is not over. If you trade some of those securities, this publication is for you.
Subscribe and unlock all the content at smartreversals.com, including market research studies and educational content including technical, macro, fundamental indicators, and trading psychology. This educational section is constantly updated and it’s worth the subscription price alone.

Other recent publications include a fundamental and cyclical analysis for Bitcoin, and the Support and Resistance price levels for over 40 securities including indices, ETFs, Stocks, and Crypto:


The paid subscription grants access to all the content mentioned and published at www.smartreversals.com.
Let’s continue with today’s analysis.
During the previous two weeks I have posted a Relative Rotation Graph featuring all the securities analyzed in this publication, the purpose is to visualize the relative strength and momentum of the securities, providing a preliminary visual of how momentum can be gained by some equities, and lost by others.
The bearish setups for PLTR, SMH, MSFT, and NVDA have not been invalidated, NFLX is joining the bearish club, and the bullish setups for BRK.B and AAPL continue playing out.
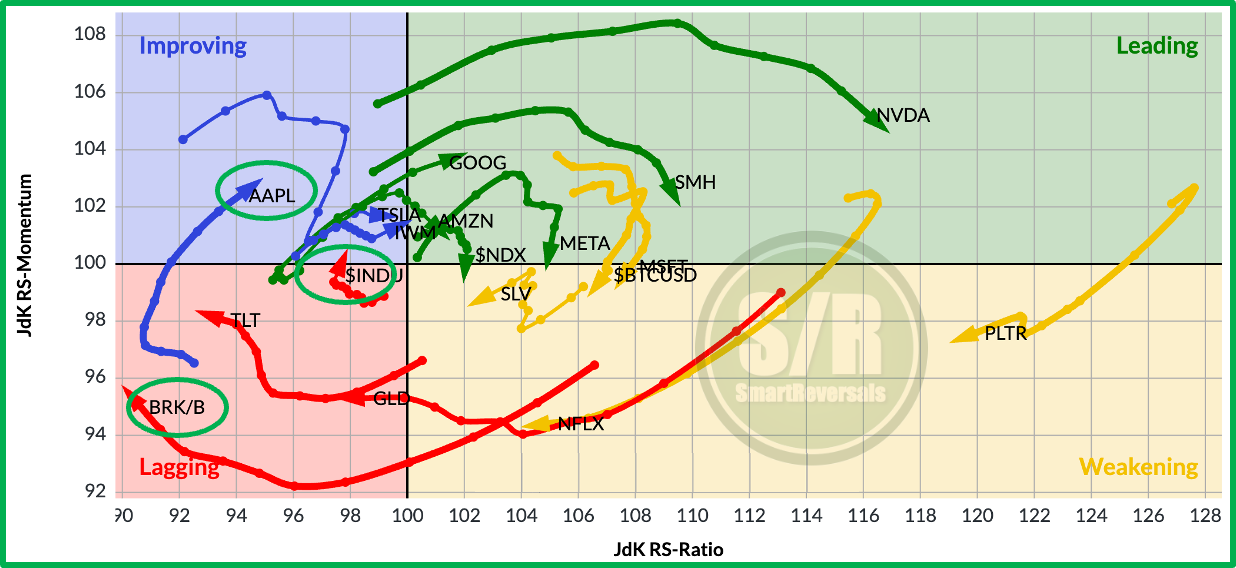
Last week I mentioned I was suspicious about the bearish setup for TSLA, highlighting that $322.1 was a zone from where the price could bounce quickly, and that’s what happened.
In the opposite way, there are references to consider that a pullback for SPX could resume considering the following bonus charts:
SPX (1/3)