
Stocks at 2026 Lows as Oil Spikes and Job Losses Mount
Markets Notch Third Weekly Decline as Middle East Turmoil Continues - Tech Giants Stumble on Energy Costs

U.S. equities endured extreme volatility this week, recording a third consecutive weekly decline and establishing new closing lows for 2026. The S&P 500 is now down -3.1% YTD, converging with the Nasdaq 100 (-3.4%), while the Dow Jones Industrial Average trails closely with a -2.8% loss for the year.
Escalating conflict in the Middle East remained the main driver of market pressure. An Iranian blockade of the Strait of Hormuz sent energy costs soaring. Oil futures closed at $99. Rising fuel costs combined with unexpected labor market weakness to stoke fears of slowing growth and rising consumer prices. The U.S. economy lost 92,000 jobs in February, pushing the unemployment rate up to 4.4%.
The energy shock also took a toll on high-growth technology companies. Major tech firms faced selling pressure as rising electricity costs squeezed margins at power-hungry AI data centers. Amazon was particularly hard hit, shedding roughly $120 billion in market value over the week. In sharp contrast, digital assets showed resilience. Bitcoin is up this week +7% as of now, recovering its Central Monthly level. Ethereum also outperformed the broader market, gaining nearly 9% during the week.
The Support and Resistance levels shared last week continue to accurately frame price action. The S&P 500 found firm support at our modeled $6,667 level to start the week, followed by a tactical spike toward the $6,857 zone. However, persistent choppy conditions triggered a reversal on Wednesday; the index breached its Central Weekly Level (CWL) and ended the week back in the bearish zone, retesting its weekly lows.
The QQQ followed an identical trajectory, oscillating between $611 and $590, both levels modeled last week, executing a sharp “inverse U-turn” mid-week. This pattern was mirrored by the IWM, which tagged our $245 support level on both Monday and Friday, despite a brief intra-week spike above its CWL.
This “inverse U-turn” was observed across the board, impacting TSLA, AAPL, META, AMZN, and even SLV. Of the equities we track, only WMT, COST, and NVDA managed to close above their respective bullish/bearish CWL thresholds, with XOM showing notable strength due to current oil price dynamics.
As anticipated last Saturday, price action has remained exceptionally choppy. Today, I want to illustrate the specific implications of VIX thresholds and price positioning relative to the Central Monthly Level (CML). These factors signaled the current environment, a series of rapid reversals within a single week. I touched on this last Wednesday, and today, I want to make those concepts graphic.
Before continuing, this publication consistently analyzes the following securities to provide a broad market perspective and empower your trading decisions. Maintaining a consistent watchlist is key to improving performance; it allows you to refine the timing of your entries and effectively rotate capital as new opportunities emerge.
Indices & Futures: SPX, NDX, DJI, IWM, ES=F, NQ=F
ETFs: SPY, QQQ, SMH, TLT, GLD, SLV, DIA, VXX
Major Stocks: AAPL, MSFT, GOOG, AMZN, NVDA, META, TSLA, BRK.B, LLY, WMT, AVGO, COST, JPM, XOM, PLTR, NFLX, V, AMD
Crypto & Related: Bitcoin, Ethereum, ETHA, IBIT
Leveraged ETFs: TQQQ, SQQQ, UDOW, SDOW, UPRO, SPXS, URTY, SRTY
Subscribe now to the paid plan, unlock the support and resistance levels modeled for next week, and all the educational content about trading with them:
Conditions Accelerating Choppy Price Action
Losing the Central Monthly level for a short period like in November happens a couple of times per year, however, few weeks ago I highlighted that staying below this level for long is a concerning condition from corrections and bear markets. Currently the price for the SPX and most of the securities from our watchlist is below this level.
(These Central Monthly Level is modeled every month and is posted every Friday in this publication for the SPX and the same 40+ securities mentioned above).
The second chart is a zoom in of the Central Weekly Level for the same period, see the price breaching the “C” marked in green in some weeks as part of the normal price action of a bull market. Since February, the dotted area shows how volatile has been the price printing multiple invalidations or reversals during the same week.
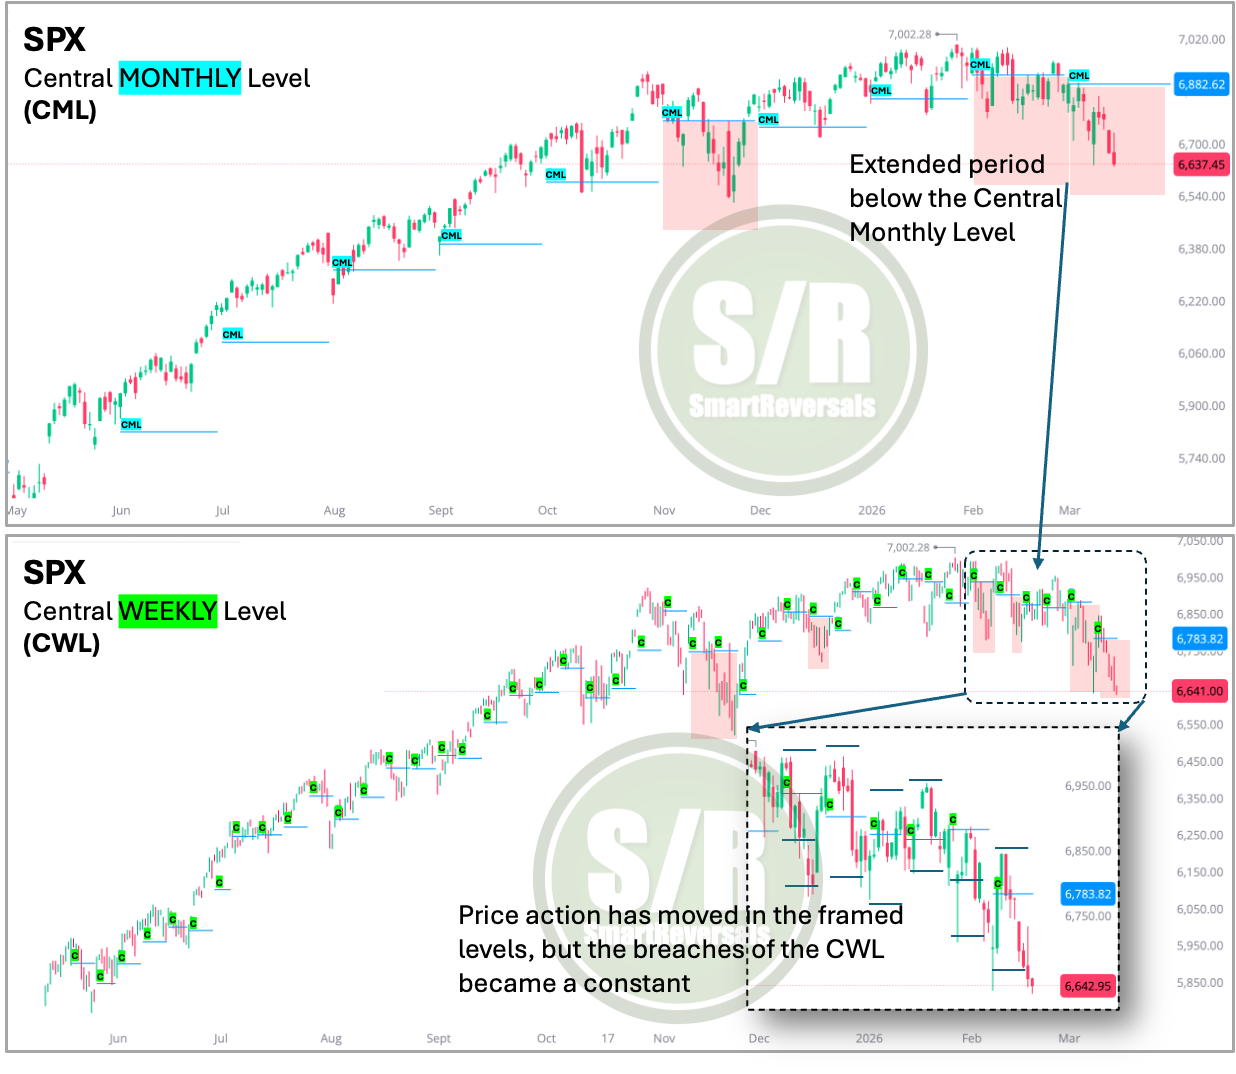
The zoomed chart includes the Central Weekly Level AND the support and resistance levels modeled with this level and for each security; see the black horizontal lines framing well the price action, and the price crossing constantly the blue line with the green “C” that is the Central Weekly Level.
That is one of the conditions, last Wednesday I mentioned another related to volatility, the next chart shows the direct correlation of the choppy price action with specific volatility ranges, following the chart you will see the weekly levels, the monthly levels (currently more important than the weekly ones based on the analysis presented), and then the combined levels.
Invalidations and volatility ranges: