Turbulent Week as Price Action Suggested
Gap Fill and More Hindenburg Omen Signals - S/R Levels for Next Week
U.S. stock markets wrapped up a turbulent week with major indices finishing lower. The Nasdaq Composite took the biggest hit, recording its worst weekly performance since April as investors grappled with concerns about stretched valuations and a possible AI sector bubble. The market’s unease showed up in the Fear & Greed Index, which settled at 21, squarely in “Extreme Fear” territory.
Friday’s trading captured the week’s choppy character. Stocks tumbled early in the session before clawing back from their monthly levels to finish mixed. The Dow managed to bounce from the weekly support $46,566 (modeled last week ahead of the recent price action), S&P 500 bounced from $6,620, (another monthly level modeled ahead of the beginning of the November), and the Nasdaq bounced from $24,649 (yes, another level provided last Friday).
The Support and Resistance Levels provided in this publication work as the frame for the week ahead, they provide an edge to investors and traders highlighting price levels where the price can reverse. They are not based on diagonals or major tops/bottoms, they are modeled based on price action, volume, and essential indicators that have proven their worth for premium subscribers.
What is more important about the levels is to know how to use them, you can have levels, but you must assess price action and technical indicators that are presented in the Weekly Compass (the weekend publication).
Economic Data Goes Dark
The week’s negative mood stemmed largely from economic uncertainty, with the ongoing government shutdown front and center. Investors took note of a worrying drop in the University of Michigan’s consumer sentiment index, which fell to 50.3, its lowest reading since 2022, as Americans voiced concerns about the shutdown’s economic fallout.
Making matters worse, the shutdown created a data blackout at a critical time. The Bureau of Labor Statistics had to postpone the official October jobs report, leaving markets to piece together information from private sources. Those private figures weren’t encouraging, with October job cuts hitting a 20 year high for the month, which only added to Wall Street’s jitters.
Technical Picture Shows Cracks
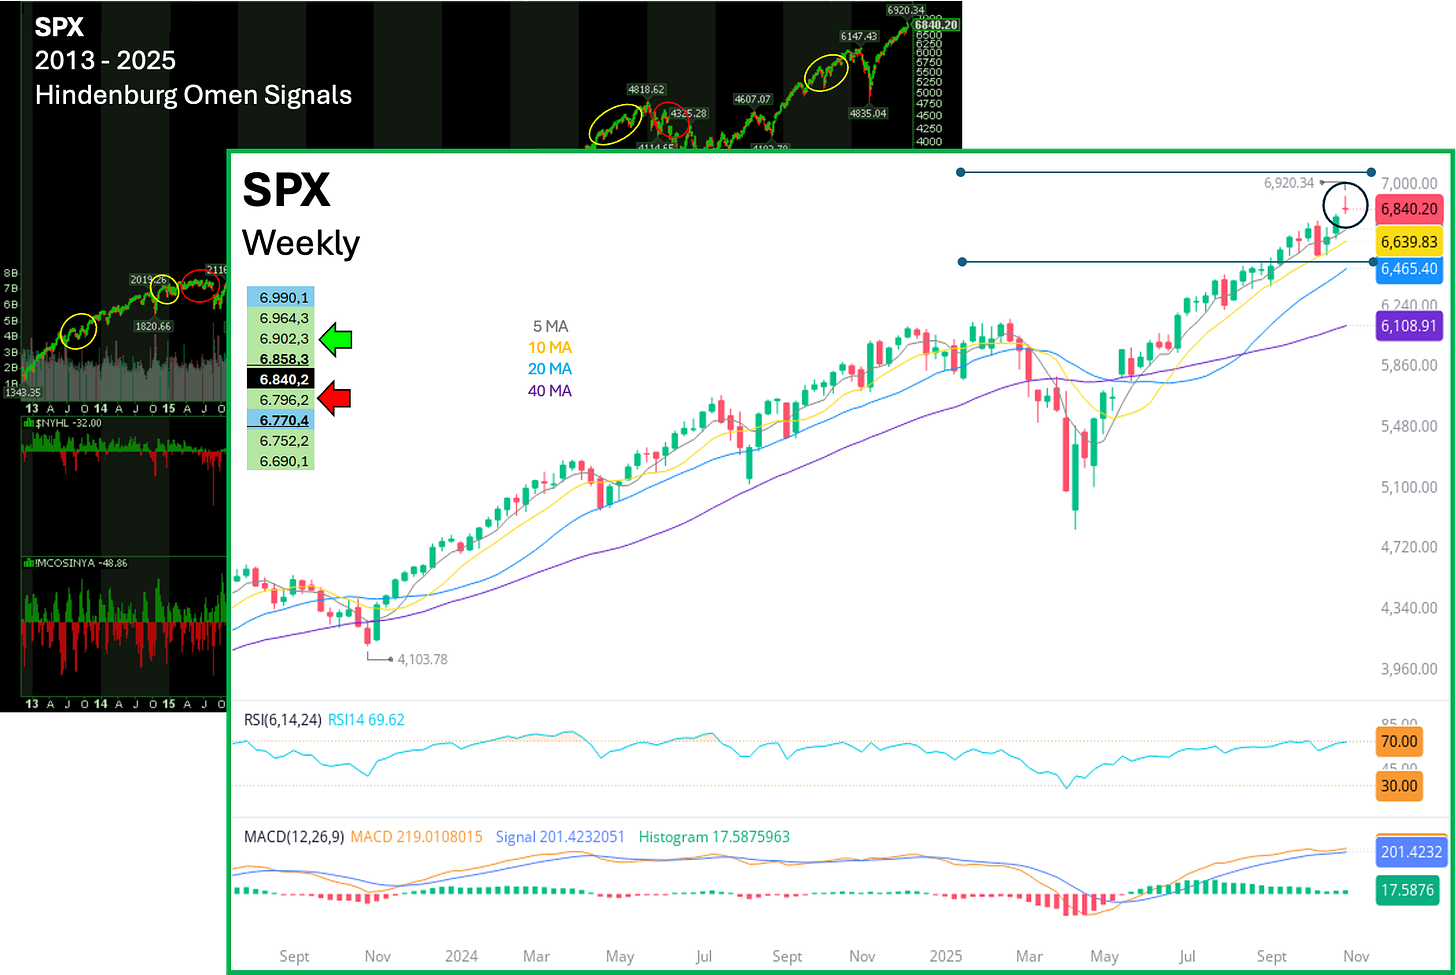
The technical setup painted a complicated picture last week, the Weekly Compass highlighted two conditions: The weekly shooting star in the three major indices, and the Hindenburg Omen signal triggered.
These two charts for the SPX were posted for premium subscribers ahead of the week that just ended, one analyzed the Hindenburg Omen signals, and the other highlighted the weekly candle with a gap, suggesting high odds for a pullback. Very important as well, the price levels at the top left of the white chart, showing the projected central weekly level of $6,858 above the price, indicating a bearish condition.
Some naming and price conventions have been removed, but you can unlock the complete information and analysis of the Hindenburg Omen signal upgrading your subscription to paid. Click Here to Upgrade.
AI Darling Palantir Takes a Hit
The valuation concerns weren’t just theoretical. PLTR shares saw a sharp pullback this week as the market reassessed its premium valuation. Despite strong growth metrics, analysts questioned whether fundamentals could justify the stock’s elevated price-to-earnings ratio following this year’s massive rally. The selloff added pressure to the broader technology sector and other high-flying AI-related stocks, illustrating how quickly sentiment can shift when valuations stretch too far.
Crypto Joins the Selloff
The volatility wasn’t limited to stocks. Cryptocurrency markets had a rough week too, with Bitcoin briefly dropping below the $100,000 mark before bouncing back to around $103,486 by Friday’s close. That still left it roughly 20% off its recent peak, reflecting the broader risk-off sentiment affecting speculative assets.
Pullbacks Don’t Occur in a Straight Line Down
The Hindenburg Omen signal (bearish) has cumulated four occurrences already during the last two weeks, something that must be assessed carefully since there were also multiple signals in April and May that point in the opposite direction (bullish). My thesis for the medium term that premium subscribers know remains intact and I will elaborate on that in the paid section below.
Apart from the bullish and bearish breadth signals observed during 2025, the price action is building on the thesis that pullbacks do not happen in a straight line down, this publication brings one essential chart for the investors or traders who make some decisions before 8PM New York time, when the after-hours session ends.
Below you will find:
An essential Volatility chart to consider directional bias for the beginning of next week.
Notes about the Hindenburg Omen signal in 2025
The Support and Resistance levels for the following securities in the week ahead:
Indices & Futures: SPX, NDX, DJI, IWM, ES=F, NQ=F
ETFs: SPY, QQQ, SMH, TLT, GLD, SLV, DIA, SH, PSQ
Major Stocks: AAPL, MSFT, GOOG, AMZN, NVDA, META, TSLA, BRK.B, LLY, WMT, AVGO, COST, JPM, PLTR, NFLX
Crypto & Related: Bitcoin, ETH, IBIT, MSTR
Leveraged ETFs: TQQQ, SQQQ, UDOW, SDOW, UPRO, SPXS, URTY, SRTY
Unlock all the premium content upgrading your subscription. Click Here to Upgrade, or use the button:
This publication also provides Fundamental Analysis that helps us understanding the price action and potential moves for the medium and long term, the latest publications were posted for:
My highlights about buying opportunities for some of them remain the same.
Let’s begin.
VOLATILITY CHART


