
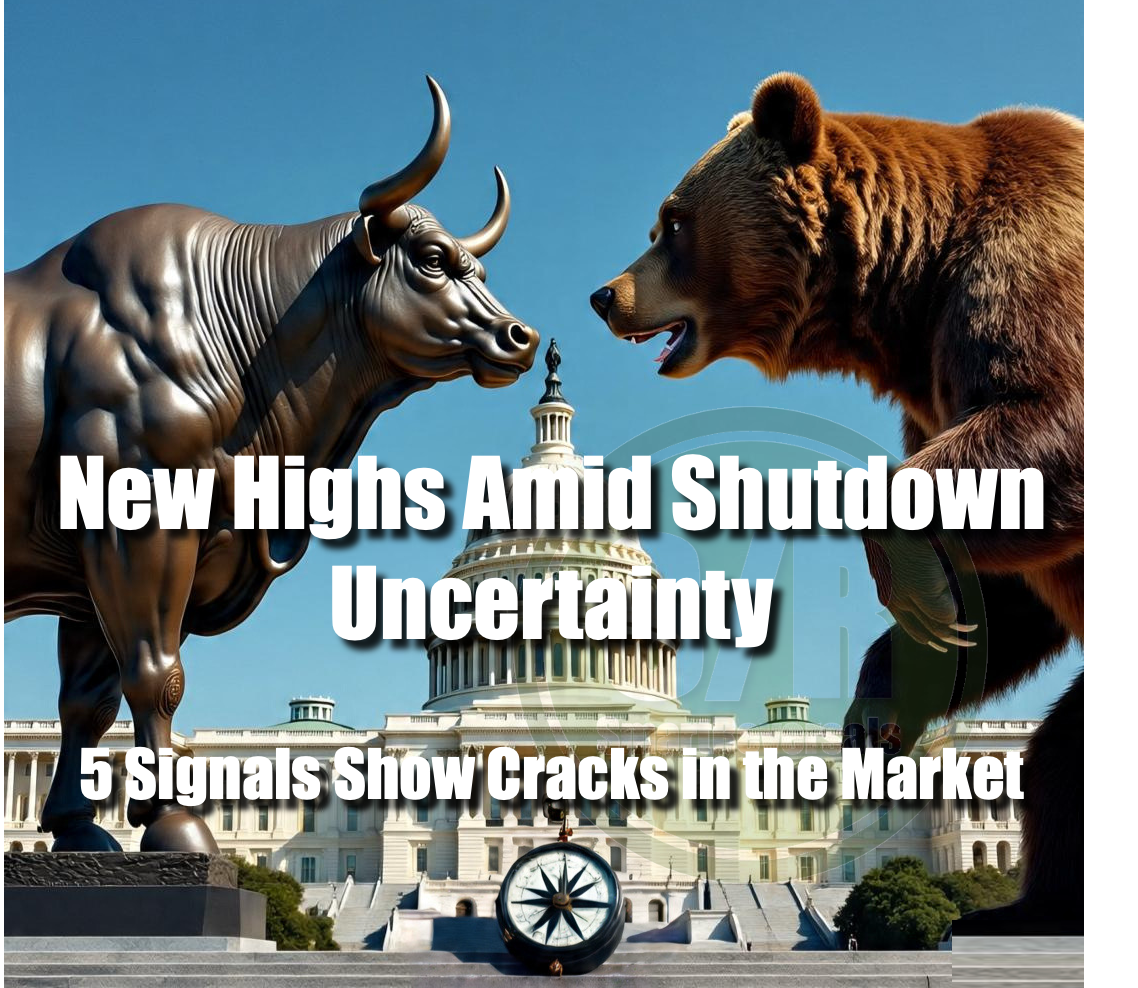
New Highs Amid Shutdown Uncertainty
Five Technical Signals Show Cracks in the Stock Market

While a market rally persists, underlying issues—both technical and macroeconomic—are surfacing. The macro environment, specifically, has revealed a profound contradiction: a simultaneous combination of a soft jobs market, weakening service sector activity, and persistent inflationary pressure.
This precarious macroeconomic setup has fueled market optimism. The ongoing US government shutdown has caused a “data blackout,” preventing the release of critical official indicators like the monthly jobs report. In the absence of this data, markets are heavily relying on private-sector reports, such as the ADP’s finding that the private sector shed 32,000 jobs in September. This soft labor reading has bolstered investor confidence in an imminent Federal Reserve rate cut this month.
However, a closer look at the available data reveals a more concerning picture. The ISM Services Index has dropped sharply to the 50% breakeven threshold, with the critical business activity component slipping into contractionary territory for the first time since May 2020. This weakness in the two-thirds of the U.S. economy is compounded by stubbornly high “prices paid” (69.4%), signaling that sticky inflation remains embedded within the service sector. This leaves the Fed in the challenging position of “flying blind” and facing a scenario of weakening economic activity coupled with elevated price pressures.
Throughout the week, headlines repeatedly included expressions like, “investors shake off government shutdown.” Tops are a process, and this media narrative reminded me of the initial days of COVID news when the market briefly continued its climb. While a government shutdown can’t be compared to a pandemic, human behavior is cyclical. Now, the technical warnings have finally consolidated, aligning perfectly with the macroeconomic conditions that investors are “shaking off”.
Today, our focus shifts to the technical signals pointing toward an overheated market that is highly likely to trigger a pullback. Over the past few weeks, we’ve patiently navigated these overheated conditions by closely watching the central weekly levels—a strategy that has proven worthwhile by preventing premature decisions. The chart from our previous publication illustrates precisely how these levels maintained the bullish momentum despite of shooting stars, divergences, or low stock participation (click the link):
Today there are five conditions that are worth watching, one of them is related to the volatility index (VIX):
The recent price action, where the S&P 500 (SPX) moved higher over the last five days even as the VIX rose, historically signals a high probability of a subsequent stock market pullback. While the initial outlook for the next week has only a 50% chance of the SPX closing positive, the risk profile significantly deteriorates thereafter. The probability of the SPX closing in the green two or three weeks later drops sharply, below 10% for the third week. This historical pattern alone suggests the confluence of a rising SPX and VIX typically resolves with a downward move over the following three weeks.
That’s not all, in the chart below for the VIX you will see a technical indicator suggesting a breakout, during the last weeks we have been tracking it, today the signal looks imminent and difficult to invalidate.
The VIX, or CBOE Volatility Index, is often referred to as the market’s “fear gauge” because it reflects investors’ collective expectation of volatility—the degree of price fluctuations—in the S&P 500 over the next 30 days. Understanding the VIX is essential for assessing market sentiment and managing risk.
Below 15: Low volatility, potentially indicating a complacent market.
15-30: Moderate volatility, considered a normal range with normal pullbacks.
Above 30: High volatility, suggesting investor fear and potential for larger price swings or corrections in the stock market.
Above 40: Very high volatility, often associated with significant market crashes or bear markets.
Based on a VIX of 30, the market might be anticipating a monthly volatility of around 8.66% for the S&P 500. Currently, with the VIX close to 17, the equivalent anticipated monthly volatility for the S&P 500 is approximately 4.91%.
While the VIX changes daily, my commitment to you is to provide documented technical facts. In that context, it is worthwhile to note that the VIX recently crossed the 15 mark, a level we have tracked closely with premium subscribers over the last few weeks.
The four other significant signals that emerged during the week, or are worth tracking going forward, are detailed below.
Before continuing, it is worth recalling four previous publications. These are essential for navigating a potentially volatile week and maintaining our principle of relying on defined support and resistance levels.
To learn more of the VIX: VIX Details Revealed - Don’t Get Caught off Guard
Confluence - Find High Probability Setups Combining Indicators
Today’s agenda includes the following charts as usual: SPX, VIX, NDX, Dow Jones, IWM, SMH, GLD, SLV, WMT, BRK.B, PLTR, NFLX, GOOG, AAPL, TSLA, NVDA, META, MSFT, AMZN, and Bitcoin. If you trade one or some of those securities, this publication is for you. Some of them are in bullish momentum, others in a bearish one, the objective of a constant universe of securities is to provide references for rotation. For example: I have been very cautious about GOOG during the last two weeks and bullish on TSLA during the last three; in both cases with specific price levels to manage risk.
Subscribe and unlock all the content at smartreversals.com.
Here is the eBook, which includes the dedicated Fibonacci Retracement section.
Subscribers with the paid plan: the analysis of the securities you suggested, using the Support and Resistance predictive model, is complete and available. Get immediate access in the premium chat:

Let’s continue with the 20+ charts with technical indicators, price levels to manage risk and consider bullish or bearish targets depending on the conditions of each Index, Stock, Bitcoin, or ETF:
S&P 500 Index (SPX) - Overbought Level Reached with a Key Divergence: