
Tech Surge: Will Momentum Hold in Key Earnings Week?
Support and Resistance Levels for the Week Ahead: SPX, Indices, Futures, Magnificent Seven and Crypto

U.S. equities ended a volatile week on Friday, April 24, with a stark divergence across major indices. Technology shares powered the Nasdaq 100 and the S&P 500 to fresh record closing highs, while the Dow Jones Industrial Average lagged behind to finish in negative territory. The Nasdaq emerged as the clear weekly winner, gaining 2.4% over the five days. The S&P 500 rose 0.6% for the week, to close at a record 7,165.08. However, the blue-chip Dow ended its three-week winning streak, falling 0.4% for the week to settle at 49,230.71.
Corporate earnings provided crucial direction for investors amid the macroeconomic volatility. Semiconductor companies drove much of the late week momentum, spearheaded by a historic 23.6% surge in Intel shares following strong first-quarter earnings and an optimistic financial outlook. This momentum sparked a broader rally across chipmakers, lifting peers such as AMD 14% and Qualcomm 11% in a single session. Tesla, the first Mag-7 reporting saw a weekly decline of -6%.
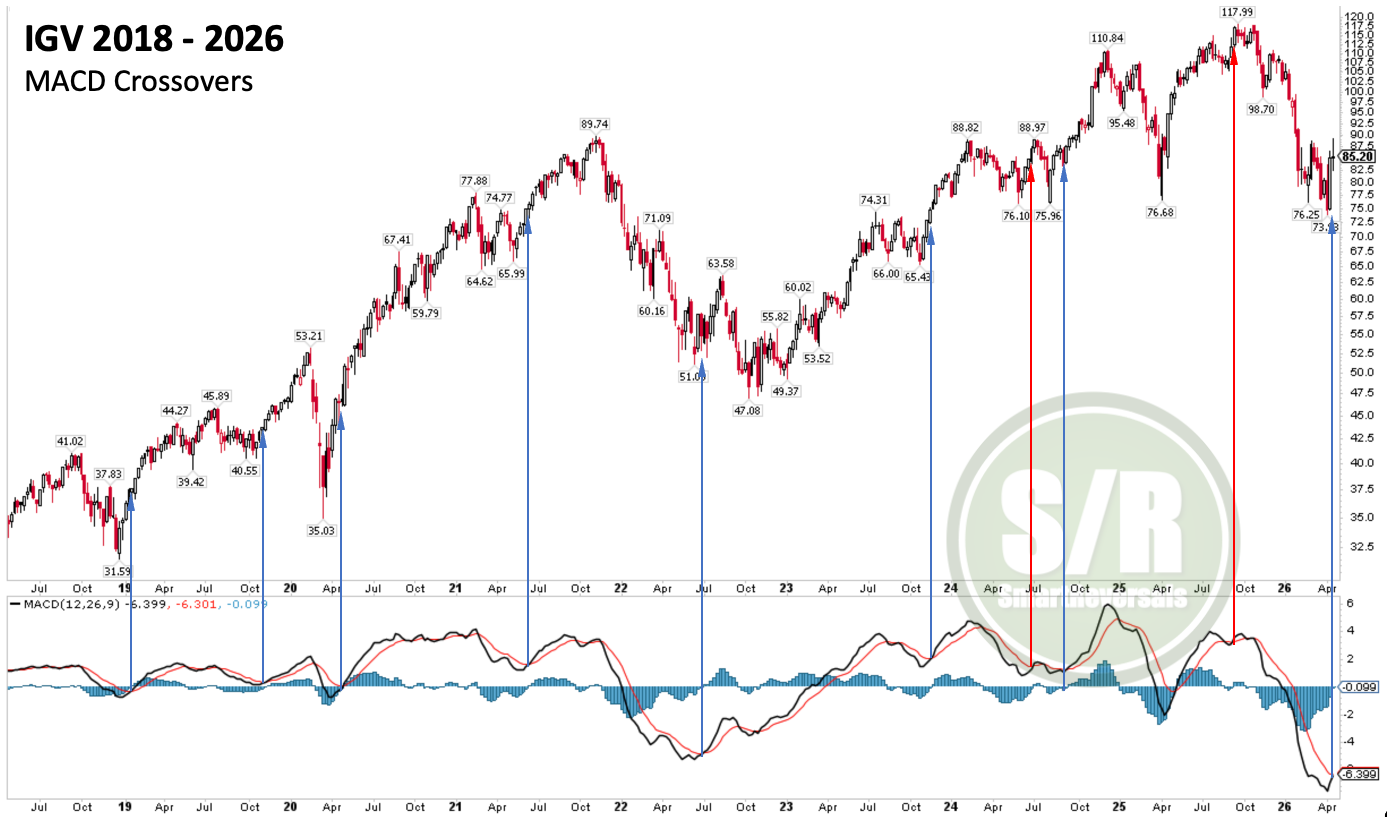
Software has been the second dominant theme this week (after Semiconductors). Interestingly, while individual names saw major sell-offs, the IGV (Software ETF) managed to close flat for the period.
The weekly chart below highlights bullish MACD crossovers over the last eight years, covering the 2018, 2020, 2022, and 2025 bear markets, alongside reversals in 2019, 2023, and 2024. Historically, 8 out of 10 of these signals were sustained, leading to continued bull trends. In only two instances was the signal invalidated, resulting in lower lows.
The data shows that bullish reversals at oversold levels (below zero) typically generate follow-through, which is the current case. For this month, the outlook remains bullish as long as the price stays above the 81.7 monthly level; a break below that mark would serve as an invalidation reference for the bullish thesis.
In addition to the technical analysis, a special fundamental study of Software was posted on Wednesday, providing a close-up on eight giants including PLTR, ORCL, CRWD, NOW, ADBE, PANW, and SAP. For investors and traders, the analyzed scenarios are a good read; some of these securities are showing interesting long-term opportunities. Get Access here:
For new subscribers, three weeks ago another fundamental special was posted, that day for NVDA, TSLA, META, AMZN, AAPL, GOOG, MSFT, and AVGO:
Both specials analyze the context for each company and medium term scenarios related to their CAPEX recovery. Subscribe to the paid plan, and unlock the content.
Find below the Support and Resistance levels for next week, including the crucial Central Weekly Level that validates momentum (bullish above / bearish below), and the Central Monthly Level that is crucial for both investors and traders, since it is breached few times per year and paid subscribers saw in March the implications of not recovering it quickly.
Maintaining a consistent watchlist is key to improving performance; it allows you to refine the timing of your entries and effectively rotate capital as new opportunities emerge. The levels posted every Friday begin with the SPX, and include the following as well:
Indices & Futures: SPX, NDX, DJI, IWM, ES=F, NQ=F
ETFs: SPY, QQQ, SMH, TLT, GLD, SLV, DIA, VXX
Major Stocks: AAPL, MSFT, GOOG, AMZN, NVDA, META, TSLA, BRK.B, LLY, WMT, AVGO, COST, JPM, XOM, PLTR, NFLX, V, AMD
Crypto & Related: Bitcoin, Ethereum, ETHA, IBIT
Leveraged ETFs: TQQQ, SQQQ, UDOW, SDOW, UPRO, SPXS, URTY, SRTY
If you trade some of them, this publication is for you. Subscribe to the paid plan and unlock all the content at smartreversals.com, including educational publications about using support and resistance levels:
Let’s begin.
WEEKLY LEVELS